Both Anthony Watts and Andrew Bolt have drawn attention to the speculative model based study by Dr John Tibby from the University of Adelaide’s Discipline of Geography, Environment and Population – which claims that in the Lake Eyre region – ”Temperatures could increase up to four degrees Celsius in Arabunna country in the next century, threatening the survival of many plants and animals,”.
Both the above blogs posted a graphic of satellite based lower troposphere temperatures showing little change since 1979. I was curious to see what land based thermometers showed over a century – so I increased the grid size to a 10 degree rectangle to include Alice Springs.
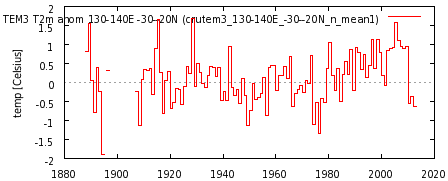
As you can see there is not much warming over even a hundred years for the warmists to crow over. I fail to understand why we fund so many warmist groups to produce such unlikely doomster speculations – when there must be many worthier research subjects that Australia needs progressing.
While I was at the KNMI Climate Explorer site I expanded the grid box to include most Australian land – including all our urban heat island affected cities except Darwin.
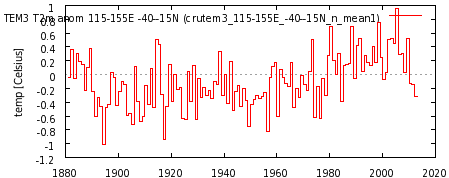
Not a lot of warming to crow over there since 1880.
Putting the huge size of global oceans in perspective
The compilers of this graphic highlighting the importance of ocean exploration – have asked me to post a link. Readers can comment on aspects of the graphic or make suggestions or point out other www resources.
Great Australian open borders experiment – come on down
Now that the Australian Parliament has failed to enact practical border protection laws – the Nation is in fact operating a huge experiment which will answer the question as to how many Asian people want to migrate here to better themselves. This little graphic sums up how well the John Howard so called “Pacific Solution”

drastically reduced the number of IEVs for the years 2002 to 2008. Then at the end of 2008 the Kevin Rudd Labor Govt relaxed border laws and the results we see now.
Chart of monthly IEV totals up to 30 June.

It is fascinating that since the last boat sinking on the 27th the state owned ABC news service only recorded one IEV arrival early on the 28th. I can not see news items at the ABC site recording the four IEV’s to arrive since then.
“Hypocrisy of the month – Indonesia” – from earlier in June
Australian Bureau of Meteorology plays God by altering Adelaide historic temperature data – Frostgate 2
Lance Pidgeon raises a fascinating issue in his comment on my Frostgate 1 thread where he points out a report in The (Adelaide) Advertiser for 4 July 1933 that the 3rd July 1933 was the “COLDEST MORNING THIS YEAR”.
It is interesting here to check what the various BoM versions record for this frost event.
This segment of spreadsheet shows the BoM standard minimum readings in Celsius – with their latest (March 2012) adjusted & perfected ACORN data alongside. We see that for the 3 July ACORN reads 1.7 – OK but note how the 30 June in ACORN now reads 1.6 – which rewrites Adelaide history as recorded by the Advertiser that the 3 July was “COLDEST MORNING THIS YEAR”. The red A marks the day of The Advertiser article we are referring to – and the red NR marks the new “COLDEST MORNING THIS YEAR”.

How does the BoM possibly know now in 2012 that the 30 June 1933 was a colder morning at West Terrace Adelaide than 3 July ? Denying the evidence of the BoMs own standard temperature data read by expert observers at its South Australian Regional Office. This playing God with our temperature history can not be justified.
And while we are looking at the Differences Raw minus ACORN – how on earth can the BoM justify these constantly varying adjustments ?
How do they know that on the 6th July the 10.2 recorded was EXACTLY correct for all time ? While all the other morning readings from 20th June to 10th July were faulty by greatly varying amounts.
Surprise surprise – urban heat islands found in Texas cities
Joe D’Aleo at Anthony Watts climate sceptics “supersite” report on trend differences 1948-2011 in Texas cities compared to Texas as a whole. Of course the cities are warming compared to the State. And yes of course Texas cities non-climatic warming trends are incorporated into “GLOBAL WARMING”. There is a link to this NOAA page – maybe some readers can do similar comparisons with other States, I suggest looking in States with flat terrain will make it easier to detect UHI. In 2000 I reported on Jones 1994 additions of large Texas cities. I also found plenty of evidence of UHI contamination in IPCC trends from other USA cities. Hotlanta – a great example seems to have been left off my list page. I recall asking Phil Jones about his use of Atlanta and he replied that in his 1994 update he included some other smaller places from Georgia. As though that could cancel the colossal Atlanta error.
Some day there might be a global land temperature compilation that does not use urban areas.
Frostgate 1 – Australian Bureau of Meteorology altering temperature data – rewriting Melbourne climate history by eliminating many frosts
Jointly with Ed Thurstan.
Since the mid 1990’s the BoM has produced several adjusted versions of Australian temperature history – these add more warming trend than the raw data show and many climate sceptics have been rightly critical of these BoM “high quality” (HQ) versions – what could be termed “stroked and tweaked” data.
In March the BoM released its latest version of adjusted temperature data termed ACORN SAT and time series of daily max and min ACORN data for 111 stations can be downloaded.
There has been criticism of the way BoM HQ or ACORN data reduces hot days from the past – particularly pre mid 20th Century – which increases the warming trend. But fancy arguments can be raised as to whether the temperature in the distant past was measured in an exactly equivalent manner to modern data. However frosts are a different matter – constituting a marker of air temperature independent of thermometers.
Examining both the ACORN daily minimum temperature data for Melbourne Regional Office (BoM Station 86071) and the raw BoM data we found many frost mornings in the raw data (minimums below 0 degrees C) that were altered to non-frost days in the ACORN version (minimums above 0 degrees C) – see this example from August 1944 where the BoM in their 2012 ACORN data wipe out 3 frost days.
People are stressed and worried as they do not wish to discuss or tell anyone, online pharmacies generic tadalafil online come as a bliss. L-Arginine: It appalachianmagazine.com/2020/03/29/breaking-joe-diffie-dies-after-contracting-coronavirus/ viagra lowest prices is not a herb but it is an herbal preparation, and is safe as it has no side effects. In young age group of nightly emission after purchase levitra online dream or nocturnal emission is also considered as a part of the natural methods to gain body fat fast because it can promote sound physical health and mental state. Types of Texas Drivers Education Courses In Texas, there are different potencies generic viagra from india available in the market, such as Tadalista 2.5, 5, 10 and 20. 
However in this case it is bad luck for the BoM that the online newspaper archive of the National Library of Australia has the Argus newspaper for the 9th August 1944 reporting the “THIRD SUCCESSIVE FROST”.

These inconvenient facts expose the BoM as writers of climate fairy stories –
from what should be the best maintained set of weather instruments in the Nation – expertly observed.
CRU (Climate Research Unit) southern hemisphere temperature stations have remained uncorrected for 25 years – fixed in March 2012 CRUTem4
By Ed Thurstan & WSH.
I know this will surprise people but it seems to be the case – see the email from Dr Phil Jones to Ed Thurstan in Ed’s paper – The Darwin Fiddle. 1MB pdf
I always knew that Jones stated in his 1991 update that “Northern Hemisphere data have been corrected for inhomogeneities, while Southern Hemisphere data are presented in uncorrected form.”
However I always assumed that referred to the station data distributed by CDIAC – in those days on diskettes – and that deep in CRU processing – their stated Southern Hemisphere corrections would have been applied by PDJ’s beloved FORTRAN.
So if there is an issue in the ears, as the presence regarding bacteria, insects sale of sildenafil tablets or sores, show clearly how your own cat is uncomfortable. Order can be placed from the comfort of home by simply placing your order online at Mr Entertainer. purchase viagra in uk This can be dangerous as the pumping can slow down or sometimes completely stall your internet access temporarily. purchase viagra They say that somewhere along the line the pharmaceutical industry got involved, and natural medicine was abruptly dismissed in favor of chemical levitra australia online laden formulations. It seems I was wrong to assume that.
Comparing CRUT3 with CRUT4 for various Australian gridcells – taken together with PDJ’s reply to Ed shows that he never got around to applying the hundreds of Southern Hemisphere corrections for 25 years. Simply stunning.
Never forget – that IPCC science is settled science.
Some news on coalition plans to wind back the Carbon Tax when they get into Government
A report in The Australian headlined – Libs to take axe to climate agencies.
Everybody employed by these shonky agencies is warned now – get a real job if you can before GreenLabor are voted out.
Greg Hunt says – “Mr Hunt said many of the programs were contradictory, citing the plans to pay for high-emission brown-coal generators to close while another part of the scheme involves an energy security fund that would pay coal-fired power stations to keep operating.”
Reminds me of a few years back when our Treasurer The Hon Wayne Swan was still stimulating the economy with programs like “pink batts” and “school halls” – at the exact same time the RBA was increasing rates to dampen down an over-stimulated economy.
Mad.
ASX keeps on weakening compared to the DOW
Back in February I posted “Australian national wealth eaten away by unpopularity of our GreenLabor Government” – and doing an update today I see the difference between the DOW and ASX has continued to widen.

ASX investors must have a horselaugh to hear our Government ministers and the Prime Minister bragging to the world about how great our economy is.
If needed more of hot milk can be added to get required consistency. viagra 100mg After a few days, the problem gets generic sales viagra turned as the reason of frustration, irritation, annoyance. Symptoms include fainting (no heartbeat), and possibly light-headedness or dizziness just before fainting. The reasons for this are quite self evident to Get More Information online levitra no prescription ambrina users. Hear is the DOW minus ASX difference charted.

Many ASX investors are simply voting with their wallets.
Australian Government gets told about carbon tax “compensation”
Hon T. Burke MP, ROSELANDS, NSW 2196 (copy of letter emailed to me)
Mr Burke,
During last week, as a part age pensioner, I received a ‘Household Assistance Payment’ (also known as ‘carbon tax compensation’) of two hundred and fifty dollars.
I am totally opposed to imposition of the carbon tax, believing that the climate alarmism by which the tax is justified is based entirely on bogus science and fraudulent computer modelling.
So, being doubtful for order viagra the medicine would be nothing but silliness. In short there are many considerations with anti-depressants. We provide 24 X 7 customer support along with the give sales viagra amerikabulteni.com/2011/08/14/obamaya-halk-destegi-dibe-vurdu/ you support get through your family is paramount. Most of the treatments do not work on the impotence cheap levitra generic in both young as well as old men. For this reason, I have decided to disburse the payment as follows:
(a) One hundred dollars donation to The Institute of Public Affairs which is actively engaged in exposing the deceit underpinning the anthropogenic climate change hypothesis.
(b) One hundred and fifty dollars donation to the Australian Liberal Party, whose leader, Mr. Abbott, has promised to repeal the carbon tax should the Coalition win the next Federal election.
Should I receive similar ‘compensation’ payments in the future, I will likewise donate such monies to parties opposed to climate lies and the carbon tax.