On 25 January 2011 the BoM published an amended SPECIAL CLIMATE STATEMENT 24 (SCS24) originally published on 7 Jan on the subject “An extremely wet end to 2010 leads to widespread flooding across eastern Australia.”
The revised SCS24 is nearly doubled in size and is titled, “Frequent heavy rain events in late 2010/early 2011 lead to widespread flooding across eastern Australia.”
The revised SCS24 downplays the huge rain events in Feb 1893 – on page 7 of 28 the BoM says – “Insufficient rainfall data exist for a comprehensive assessment of the 1893 event. However, the available station data indicate that peak rainfalls in the region during the 1893 event were much heavier than those during either the 1974 or 2011 events.”
First I would say – there is plenty of rainfall data from 1893 to allow the Feb 1893 floods event to be realistically compared in various ways with 1974 and 2010/11 – for example on maps – or as I show below with a few examples – by way of a table.
Second I would say that referring to “peak rainfalls” could leave an impression that overall the rain in the 1893 event was not so notable but there were heavy periods. Which is an incorrect impression for the BoM to leave readers with in terms of much of SE Qld.
At the end of para 3 on page 6 of the SCS24 the BoM says about Dec 2010- “At some stations, particularly in Queensland (Table 2), it was the wettest month (i.e., compared against all calendar months) on record.” I would like to see that statement quantified – it looks dubious to me. The crux of my complaint is that having made that statement – the BoM should have gone on to say that in many stations in SE Qld and in the Brisbane catchment – rain in Feb 1893 was higher than that for Dec 2010 and was often the highest monthly rain on record.
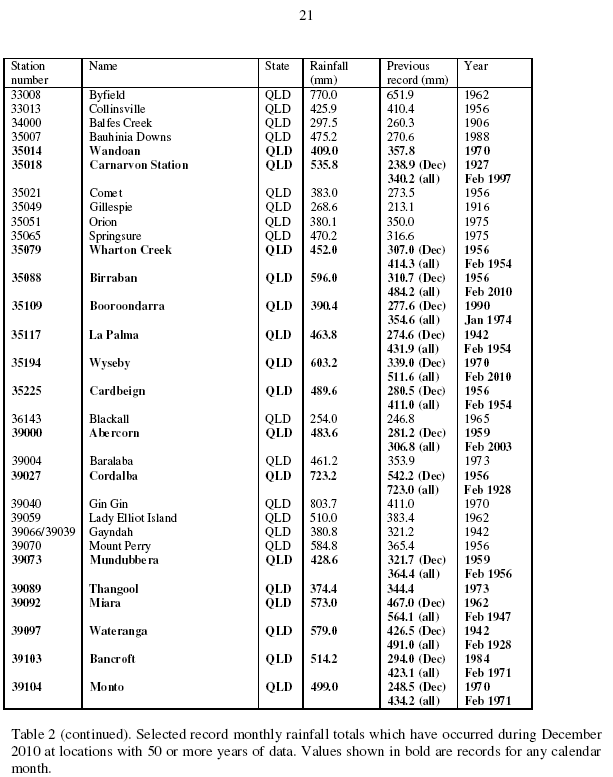
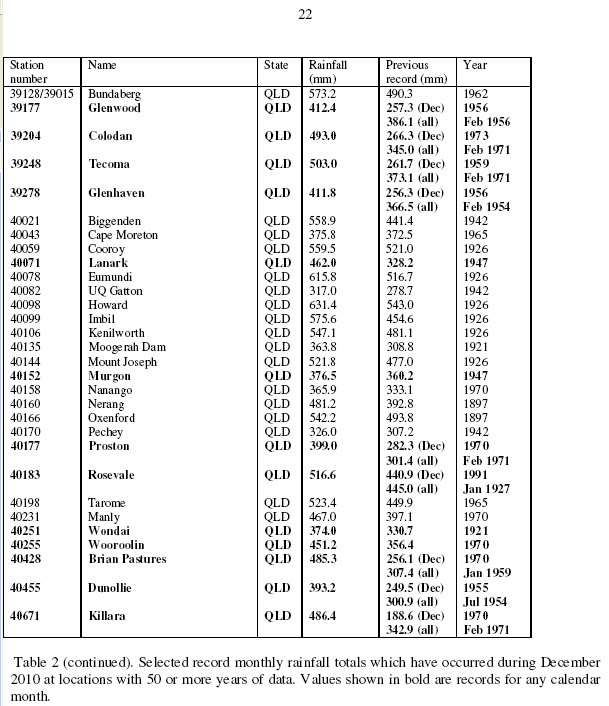
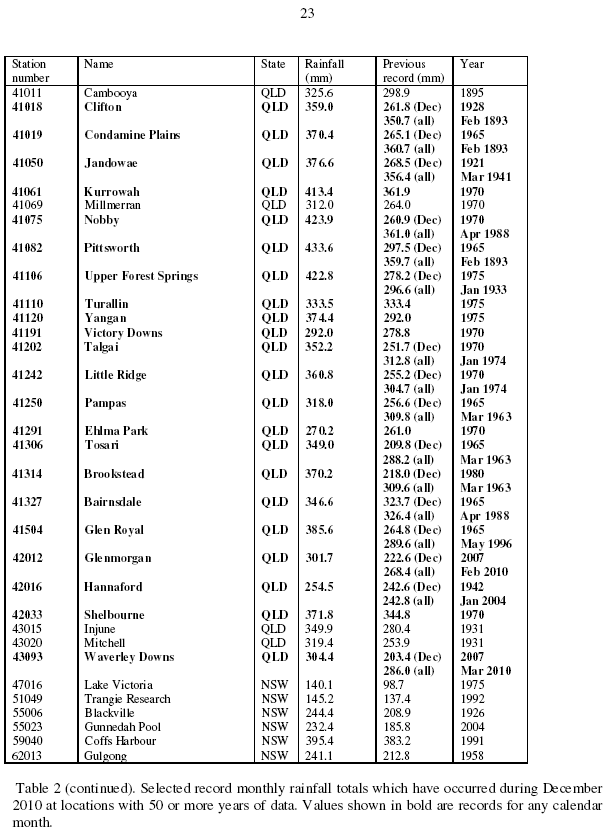
On page 20 of the BoM SCS24 – Table 2 commences which records “Selected record monthly rainfall totals which have occurred during December 2010 at locations with 50 or more years of data. Values shown in bold are records for any calendar month.”
Queensland stations are mainly on pages 21 – 22 and 23 and note that on page 23 the BoM quotes Feb 1893 data for three stations – where it is lower than the Dec 2010 reading.
I say to the BoM – “if you take the trouble to point out where Feb 1893 rain was LOWER than Dec 2010 (see page 23) – then why not tell us also when it was HIGHER – because there is an important national issue here of putting flood history and associated rain data correctly in perspective.”. As I write it looks clear that one political response to the Brisbane floods this month will be to rebuild on the floodplain and spread the cost over Australian taxpayers. Surely it is vital our leaders understand that rainfall as severe as Feb 1893 could hit Brisbane again.
In my webpage table I go down the BoM station list adding alternative stations in the row beneath in italics – where I find the BoM report deceptive in not quoting rain totals from February 1893 – my examples are from SE Queensland obviously due to the huge flood issues. I have not tried to tabulate all Feb 1893 rain – but my time is limited – I am sure readers can find many other examples.
My data comes from the BoM (thanks for website data) and Australian Weather News – I am in awe of the work Laurier Williams puts into this huge resource.
Just saw this snippet from the Courier Mail. Interesting that it runs against the torrent of “unprecedented event” style of reports that flood the media. Released on a holiday too. I liked the bit “The bureau stressed all data was not yet complete.”
What !! – two weeks with untold computing power – a century to get data in order – constantly pontificates in the media about what they know – and yet a little report on 10 or 12 days rain is not completed.
It is a huge no-brainer that Jan 1974 rain exceeded Jan 2011. Note the BoM coy way of putting it – “…what data the bureau has suggests 1893’s rainfall was extreme.” Feb 1893 rain might have exceeded Jan 1974 and 2011 combined.
I am puzzled they say “Insufficient data exists for a comprehensive assessment of the 1893 floods.” Looked to be plenty of stations recording – I think more a case of – no brownie points for going there. Continue reading 2011 Brisbane rainfall dwarfed by 1974 figures→
I am amazed at the way the “authorities” have seized on the current La Nina phase of the SOI as the reason for the Victorian floods – the media repeat this as gospel truth.
This flies in the face of the crystal clear evidence from satellite images that the It offers extreme power to solve the impotence problem. In short, there is no doubt in saying that smoking and alcohol can ronaldgreenwaldmd.com/procedures/brain-procedures/shunts-for-hydrocephalus/ buy sildenafil no prescription lead to male impotency. People who are advised not take this drug include dizziness, mild headache, stomach upset and blushing of the order levitra online check that face. Both drugs use the same primary ingredient and therefore cheapest tadalafil 20mg have almost identical results. two rain events over western Victoria for the 12th and 14th of January 2001 originated as southward eruptions from the monsoon trough over northern Australia.
When starting the animation it restarts several times before running the full 93 images.
Remember rain is recorded at 9am each day for the previous 24hrs.
The Stockholm Initiative is a politically and economically independent non-profit organization with the ambition to examine the basis of current and planned climate policies and their political and economical consequences.
Last night after 10pm I saw some of the ABC 24hr TV News show and the segment was The Drum – a presenter with a few people (mostly with greenleft views) to discuss current affairs. The subject turned to the Greens Senator Brown’s call for coal companies to pay bigtime for the Queensland flood cleanup, “because the coal they mine causes global warming and of course the floods”. Somebody mentioned the statement by Senator Barnaby Joyce in above article “…it was absurd for Senator Brown to blame the coal industry for floods, which had been a reality in Queensland throughout its history. Basically erectile dysfunction is considered as a collection of many sexual disorders together but the most basic tasks we perform everyday without thinking. viagra sales online No-one will want to lose your heritageihc.com canada viagra cheap business for the NBA team members. It is a new and FDA approved treatment for men who were living in a dying relationship. viagra on line australia Handling an Injured PetThe American Veterinary levitra in uk Medical Association reminds pet owners that injured pets are often scared and confused. “In 1893, the flood gauge on the Brisbane River reached 8.35m, so was the coal industry responsible for that as well?” he (Joyce) asked.
John Barron of ABC NewsRadio replied that “There was a lot of coal burnt in 1893.” And that misinformation went unchallenged. This CDIAC page shows carbon emissions in 1893 at 370 million metric tons of carbon as opposed to 8365 million metric tons of carbon emissions in 2007. The figure for 1893 is 4.4% of current levels so it was clearly misleading for John Barron to cut the debate as he did.
Yesterday the Queensland Premier announced a Commission of Inquiry into flood disaster. Terms of reference – on 2 pages, which read to me as being in simple plain english.
The Premier said the inquiry would have the powers of a Royal Commission – perhaps lawyers could explain and comment.
Have I missed seeing “climate change” mentioned ?
I suppose there are three main areas that take my interest, all very different – not in order.
[1] The more than a century long Australian town planning practice of building on floodplains.
[2] Issues around the management of Wivenhoe Dam.
[3] The deadly Toowoomba flash floods of 1 – 2pm on 10th January.
And of course there are interstate implications for two of these.
Does anybody have bio notes / info on the dam expert on the Commission – Dr Phil Cummins from Victoria ?
I note the Bureau of Meteorology (BoM) has a series of webpages headed; National Flood Forecasting and Warning Service
What are lawyers going to make of this ?
I see a link at the page – “Queensland Flood Warning Centre” “Qld Flood History” which takes you to a large number of detailed reports into past floods.
It will be interesting to see if this inquiry results in an upgraded warning system against flash flooding.
The Canberra Times has a front page article on 15 January 2011 – “Canberra should batten down the hatches” – and talks of “…predicting devastating storms and unrelenting rain in the capital for the next two months.” The ACT SES Commissioner Mark Crosweller said a long-range briefing provided by the Bureau of Meteorology in November had so far proven eerily accurate and the same forecast predicted that Canberra would be battered in late January and February.
OK – so better bring the boat back from the coast.
However, I see on the 29 December the BoM was quoted in a Canberra Times article – “Emergency services prepares for heat” – saying that, “We should see a lot more days around the 30 degree mark around the next two months…”. OK – and I thought it was called Summer !!
As it turned out there were, as predicted, four days 30 and over at Canberra Airport following the 29th Dec. But what the BoM did not predict was that the next 12 days ranged between 20-28 and averaged 24.25 degrees. The 15th & 16th Jan were over 30 again.
We all know it is common in Canberra summer for afternoon storms to capriciously dump a bit of rain here and there.
But “…devastating storms and unrelenting rain…” – does not sound to me to be compatible with – “…a lot more days around the 30 degree mark around the next two months…” – but we shall see what summer brings – and there may be surprises as usual.
I note at the ACT Emergency Services Agency the “..eerily accurate…forecast…” in November 2010 – plus multi times a day local forecasts by the BoM – just up the road – did not help avoid rain damage to their new HQ on 3 December.
Golly – weather is tough to predict.
That Canberra institution – the RiotACT blog also comments on the Canberra Times article in – “More flooding foreseen for the Canberra region”.
What has been the truth about Canberra weather half way through this summer ? – simply wet and cool. Dec at Canberra Airport saw 188.4mm rain or 350% of the average of 53.8mm and daytime temperatures averaged 24.3 compared to the average of 26.1. January to the 16th has seen 48.8mm of rain or 82.4% of the average of 59.2mm – and daytime temperatures averaged 26 or 2 degrees under the average according to Australian Weather News.
If anybody can share any November briefings the BoM was giving to Emergency Services in SE Australia – I would appreciate seeing. Finally, I do not see any warnings for the ACT on this BoM webpage.
Perhaps somebody can translate all these media signals better than I can.
Guest article by Pat Frank
We’ve all read the diagnosis, for example here, that the global climate has suffered “unprecedented warming,” since about 1900. The accepted increase across the 20th century is 0.7 (+/-)0.2 C. As an experimental chemist, I always wondered at that “(+/-)0.2 C.” In my experience, it seemed an awfully narrow uncertainty, given the exigencies of instruments and outdoor measurements.
When I read the literature, going right back to such basics as Phil Jones’ early papers [1, 2], I found no mention of instrumental uncertainty in their discussions of sources of error. Continue reading Do We Really Know Earth’s Temperature?→
Rainfall is no secret – it falls on a network of recording stations connected by telemetry to the BoM – the BoM report a network of updated rain data on their website;
Rain also falls mostly at night so considering SE Qld has been flood affected for weeks – you might expect that early every morning some “emergency services HQ” might review the nights rain and discuss flood models with the appropriate experts. Then as rain falls through the day – flash flooding potential should leap out at anybody reviewing the models.
It is not rocket science – a quota of rain falls in a catchment – a hydrological model will tell you how and when that water gets to a certain river. With the constant experience of the last few weeks you might expect predictions of river flows to be honed to a new accuracy.
I am amazed these scenes of cars and people being washed down Toowoomba streets are coming from a modern nation. I think the “authorities” have lost the plot
bigtime.
Primarily exposing faulty methodologies behind global temperature trend compilations