Minus 7.2 is the coldest daily min for June at Canberra Airport since 1986
I have not found that the ABC www has reported this.
It flies in the face of what BoM said on 1st June.
The Bureau forecasts warmer and drier winter conditions for much of Australia 01/06/2023
media.bom.gov.au/releases/1169/the-bureau-forecasts-warmer-and-drier-winter-conditions-for-much-of-australia/
I notice Weatherzone skillfully confuses the issue with any month.
Ben Domensino, 21 June 2023, – Coldest morning in 5 years for parts of NSW, QLD, ACT
www.weatherzone.com.au/news/coldest-morning-in-5-years-for-parts-of-nsw-qld-act/1342232
The minus 7.2 flies in the face of the ever increasing Canberra urban heat island – just checkout recent developments near Canberra Airport.
Does not exactly back the warming meme that demands we commit to NetZero by whenever.
Category Archives: Urban Heat Islands
Canberra equal record cold morning from 24 years ago
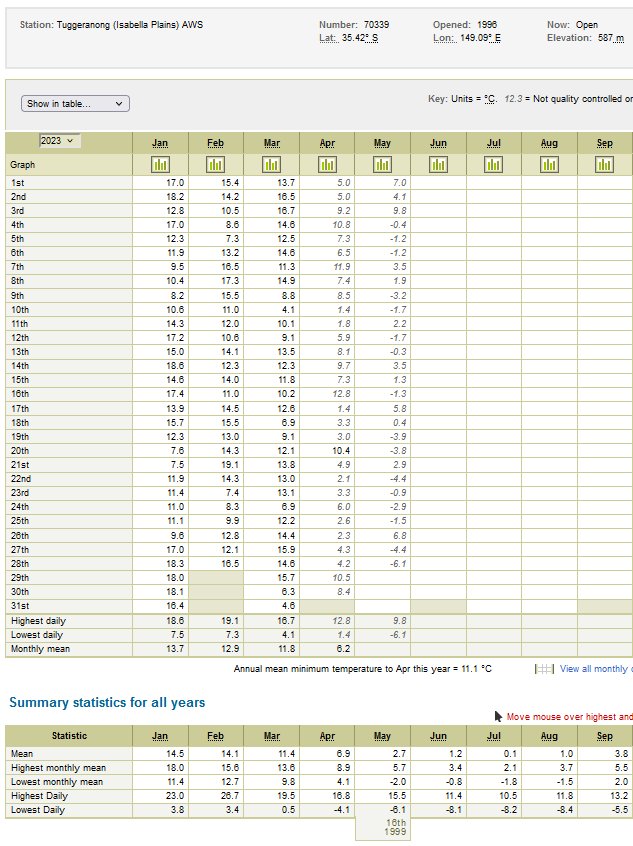
Tuggeranong (Isabella Plains) AWS Number: 70339 just recorded minus 6.1 degrees equal to 18th May 1999.
And against the growing Canberra urban heat island UHI.
I aim to post a screen save overnight if my %@@#%ing software will do the upload. www.bom.gov.au/jsp/ncc/cdio/weatherData/av?p_nccObsCode=123&p_display_type=dailyDataFile&p_startYear=&p_c=&p_stn_num=70339
Some main stream media commentary from Weatherzone.
Corine Brown, Today, 4:03 AM AEST
Nation shivers through coldest May morning in decades
www.weatherzone.com.au/news/nation-shivers-through-coldest-may-morning-in-decades/1295094
Six ALDI red or white to anybody spotting the MSM mentioning UHI in these circumstances.
Here is link to my screensave of – Tuggeranong (Isabella Plains) AWS Number: 70339 just recorded minus 6.1 degrees equal to 18th May 1999.
www.warwickhughes.com/agri16/Tugg-equal-record-cold28May23.jpg
Big Autumn cooling hits Sydney says Weatherzone
Weatherzone has a good story in their News section headlined “Sydney struck by big autumn cooling 13May23”
www.weatherzone.com.au/news/sydney-struck-by-big-autumn-cooling/1268201
Thats Sydney Australia downunder.
But of course as usual Weatherzone never fail to ignore saying this cooling is in the face of the largest urban heat island (UHI) on Wide Brown Land.
Note too Chris Gillham’s charts showing the cool Australian summer is carrying on.
Despite BoM’s frantic media about “Heatwaves”.
www.waclimate.net/australia-cooling.html
Auckland floods spark climate change claims
We have probably all seen TV or www news of the Auckland floods of a week ago tomorrow.
I have assembled the links below and also listed points A to F to provide some perspective.
No news items mention basic facts that –
[A] – Rain gauges were very sparse in the 1800’s and pre-WWII compared to today.
[B] – Unbuilt vegetated land and natural bush that would have soaked up rainwater and impeded water flow was much greater in area in the 1800’s.
[C] – Tarmac, roads and buildings that increase the rate of runoff were greatly less in the 1800’s and pre-WWII.
[D] – It would be doubtful that custodians of the few rain gauges in the 1800’s and pre-WWII were systematically noting rain over periods shorter than one day.
[E] – So making claims about recent rain when we have dozens and dozens times the rain gauges now than we did in the 1800’s risks conclusions that are unscientific.
[F] – Research into early newspaper archives should reveal reports of rainfall causing floods which may add to data to compare with recent times.
Auckland sets new all-time daily rainfall record – Jess Miskelly, 28 Jan 2023, 1:07 PM AEDT
www.weatherzone.com.au/news/auckland-sets-new-alltime-daily-rainfall-record-/1069729
Three people dead and at least one missing as rain pounds Auckland 28Jan23
www.abc.net.au/news/2023-01-28/three-people-dead-one-missing-as-rain-pounds-auckland/101903134
New Zealand’s north island hit by flash floods, landslides for third day, as death roll rises to four 29Jan23
www.abc.net.au/news/2023-01-29/auckland-starts-clean-up-after-deadly-flash-floods/101904116
More heavy rain expected for New Zealand’s flood-ravaged Auckland 31Jan23
www.abc.net.au/news/2023-01-31/more-heavy-rain-expected-for-new-zealand-s-flood-ravaged-aucklan/101910300
Auckland’s historic flooding explained in five charts 31Jan23 by Marc Daalder
www.newsroom.co.nz/sustainable-future/aucklands-historic-flooding-explained-in-five-charts
It could have been mentioned re the last chart that the UHI(Urban Heat Island) effect would be adding to warmth in Auckland.
Marc Daalder is to be congratulated for venturing into the subject area of charting rainfall data which is rarely seen in the main-stream-media.
Good on you Marc. However it is a shame NIWA took 1965 as a starting point when I bet Kiwis have been recording rainfall for at least a 100 years before that.
Sydney enjoys 323 days under 30 degrees in our largest UHI
2022 ended up cooler than normal towards the end see Chris Gillham’s great www pages –
Australian climate cooling since 2012.
www.waclimate.net/australia-cooling.html
And today Sydney Observatory Hill just recorded over 30 degrees – read about the significance at Weatherzone.
www.weatherzone.com.au/news/sydney-ends-nearrecord-run-below-30-degrees/1050804
Sydney ends near-record run below 30 degrees 18Jan23. Quote [ Prior to today, Sydney’s last day above 30ºC was on February 21, 2022, meaning the city just had 331 days between temperatures over 30ºC.
This is the city’s second longest gap between 30ºC days in records dating back to 1859. The only longer period between 30ºC days lasted for 340 days, between December 31, 1882, and December 6, 1883.]
Weatherzone also note at the end of their article – Quote[Considering Sydney’s near-record run of days below 30ºC in the broader context of climate change makes it an even more impressive feat for the city. Observations from Observatory Hill show that the city’s mean annual maximum temperature has increased by around 1ºC between 1910 and 2021.]
How stunning that they would “touch their forelock” to “climate change” but not mention the location in the largest urban heat island in all the wide brown land.
2023 In Australian is starting cool but what else is due this year? Will add to this post later.
Perth Airport max T history 1945-2021
An email from Perth pointed out the plentiful mild weather lately. I see that Perth Airport 9021 is used in ACORN so I have had a look-see at all the raw monthly max data from CDO – (December data up to 16th so far).  The first thing that hits me is a step-change coincident with the June 1994 install of a temperature probe (AWS). For larger version chart. Yet the BoM ACORN version for 9021 has no adjustment at 1994. The other point I would make is that UHI would have been steadily affecting this site as Perth housing & suburbia expanded producing warmer breezes. I can look at ACORN data later.
Here is a chart of raw monthly min data from CDO. Less noisy than the max. 
For larger version chart.
Here is a chart of annual mean T plus annual Range (mean T is the metric for “IPCC Global Warming/Climate Change”)  For larger version chart.
ABC misinforms on Sydney UHI and fires
The article starts with some reasonable points about UHI in crowded new suburbs but then quoting an academic claims the BoM station sites do not reflect the UHI completely missing the fact the breezes and wind do blow and UHI affected air will move through the thermometer enclosures affecting BoM published weather observations.
Then further down quoting another academic in a para starting… [Studies following the 2019–20 bushfire season found that climate change had made fires a conservative 30 per cent more likely.] Statements are made about the 2019/20 fire season amazingly forgetting to quote the BoM’s Sep 2019 account of “Sudden Stratospheric Warming” over Antarctica and predictions for the coming 2019/2020 summer drought and fire season.
Surely Australian taxpayers deserve better than experts amnesia on this scale.
54 year record run cold Sydney nights – no mention UHI
Ch9 news reports Sydney records coldest stretch of May days in 54 years but not a word I saw on being more impressive for the location at the core of the ever growing largest Australian urban heat island (UHI).
BoM omit UHI/etc claiming Perth hottest ever April day
Over a century of urban development must feed in to daily max and mins as would the late 20th Century change to AWS readings compared to to slower responding liquid in glass thermometers.
Some old blogs — Satellites define the surface urban heat island (UHI) for 419 global cities 25Feb2013
The ever watchful Chris Gillham emailed this in re a hot day in April 1879. Chris Gillham Scribeworks
UHI lost in Euro heat news
In the latest flurry of news from Europe about their summer heat records – has anybody heard the UHI (Urban Heat Island) referred to? Luke Howard who published on the London UHI near 200 years ago would turn in his grave. Even Catallaxy is onto the issue. If anybody notices the UHI referred to in meedja please tell us.