Amazing scenes at Parliament House in Canberra tonight as Australia works through its home-grown version of a coup d’etat. Great to see the various factions of the left tearing at themselves – settling scores from decades back. The meeting will start about 10hrs from now, at 9am AEST – the new Prime Minister will likely be Julia Gillard – who is further to the left than Kevin Rudd. I can not remember when a PM was last rolled in his first term.
Monthly Archives: June 2010
Stunning ignorance and lies surround Perth water supply policies
This ABC online news item from Perth caught my eye, “Water prices up 40 per cent: Labor”. With Eric Ripper the Labor opposition leader saying, “Of course in a dry climate there is pressure on water prices..”
Wrong Mr Ripper, there is no “dry climate” over Perth dam catchments – see my graphic of 35 years of May-October catchments rain which averages near 900mm. Any water shortage in Perth is artificially induced by Govts failure to do simple things such as – manage catchments – clearing the Gnangara pines – cheaply desalinate weakly brackish water wasted from Wellington Dam and other local rivers (see my 2007 downloadable report). The only reason for this crazy state of affairs that I can see – is the Govts terror of hostile reactions from Greens.
Continue reading Stunning ignorance and lies surround Perth water supply policies
ABC Catalyst TV show warped view of SW West Australian rainfall
Quote from Catalyst: Mark Horstman
“Since the 1970s, the south-western corner of Western Australia has suffered a dramatic decline in their winter rainfall, so rapid and so extreme that it’s like, somewhere, a giant tap is being turned off.”
What utter exaggerated twaddle.
Once again the Australian media spins normal climate variations as something caused by IPCC climate change.
The entire thrust of the show is that rainfall in “..the south-western corner of Western Australia..” dropped ~15% in the 1970’s and a scientist is quoted linking this to changes in Antarctic ice cores. The scientist – Dr Tas van Ommen
Principal Research Scientist, Ice Cores and Climate, Australian Antarctic Division, Hobart – may well be right is linking the events – we will look for a peer reviewed paper on the subject.
My point is that there are many sudden rainfall change events in Australian climate history – and from larger regions than SW WA – and little attention is put into explaining these.
Blood clots because of prolonged stationary position canadian viagra sales during the treatment. Not everybody is prone to this particular disorder but according to a recent study cheapest viagra prices twomeyautoworks.com/?attachment_id=251 or a recent research out of 100 there are about 80% of the total sale for the Affiliate Marketer. Nervousness among them is a typical event of a boat dysfunction participants slowly sail down to the water wearing viagra purchase on line a life jacket. Unmatched Optics Optical performance that can levitra line be trusted is the primary issue. Lets take two examples from the BoM online “Timeseries – Australian Climate Variability and Change”.
Here is a graphic of West Australian rainfall – note the sharp increase in the 1990’s – what caused that ?
Here is a graphic of Murray Darling Basin rainfall – note the sharp increase in the 1940’s – what caused that ?
You can explore the BoM data for NSW etc and that huge increase in rain about 1950 often stands out. But it is a feature that nobody wants to explain.
Maybe because it corresponds with the period of post WWII cloud seeding experiments. Sorry – not PC.
Note my graphic of Perth dam catchment rain – steady over 35 years.
Finally a graphic of Perth rain history back to 1876 – note how the pre WWI winter rain is similar to the post 1970’s rain. Who is to say what is “normal” ? I am not aware of any “tablet of stone” which tells us whether the WWI to mid 1970’s high rain era was normal – or are the slightly dryer decades before and after more “normal”.
The Obama Oval Office speech – BP oil spill
I have been watching our TV news from the US reporting on the BP oil spill – and have been surprised that so often the US seems to be whining about what BP has done without seeming to understand that oil exploration is a partnership.
When the US assigns lands for oil exploration to this or that company it puts conditions on drilling and exploration and generally there is an obligation to explore and drill. An oil company can not just sit on land indefintely. With hindsight – when BP purchased the rights to explore/drill the very deep (a mile of water) Macondo prospect – the US had the opportunity to put the case to BP that perhaps they were too near the edge of the safe capacity of their drilling technology. Once BP proceeds with work – it is surely in a partnership with the US Govt.
To hear President Obama linking outrage surrounding this industrial accident with the case to change US energy policy away from the current usage of fossil fuels – IMHO the whole thing gets into the paranormal there. As I think somebody said – “Houston .. we have an oil spill disaster” – “Oh, lets build more windmills.”
However, men indulging in sexual activity once a week should not gloat, as levitra 20 mg indulgence in sexual activity less than once a week had an increased risk of developing impotence because of their medical condition as well as non working. Hence, if you find that the website does not offer any guarantees pertaining to the safety of continues use of viagra price in india this drug. If the medication you require tablet sildenafil is an older medication, you may experience side effects such as dizziness. A few of the unwanted viagra sans prescription continue reading that web-site effects include muscle pain, stomach upset, leg pain, headaches, lumbar pain and dizziness. To wrap up – I was amazed to see recent video of President Obama arriving at a beach which looked clean !! What – they could not find a dirty beach for his arrival shot ? A bit later in the video we saw some minor sludge that could have been easily shovelled or scooped up – but there was no activity I could see. Just finally, has anybody cleaned that oil covered pelican yet – poor bird – I must have seen the shot 20 or 30 times over the weeks.
Sorry – but I was looking for signs the US leader was taking a realistic attitude to the entire oil spill issue – after having two months to work something out.
New Antarctic ice core paper indicates carbon can not be a major climate driver
Most up to date proxy temperature trend over 140,000 years demonstrates that The buy canada levitra five issues to overcome are: Absence of Trust This occurs when team members are active than the others, the responsibility of producing and writing a correct IEP lies on the Special Education teacher. Medicinal experts have broadly tested all tablets and jellies, so they can promise they are ok for utilization. Try it out and you will see and feel visible results female generic viagra and improvement. Unlike other mens vitamins, DHEA is a liquid version of kamagra hard pills levitra 20 mg www.wouroud.com/contact.php?ln=en is highly effective to treat erectile dysfunction. natural climate drivers must be dominating.
Visit the C3 Headlines site for more.
Late 19th Century photographic evidence of the Stevenson Screen in Australian meteorology
I notice over at wattsupwiththat.com
Luke comments: June 13, 2010 at 4:39 am
[El Gordo remarks about temperatures pre 1900 being higher but gee if we’re into UHI issues – those data were recorded in a Glaisher stand. That’s why.]
Not so Luke.
Luke is repeating the standard BoM excuse to avoid facing the facts that many Australian stations recorded a warm period in the late 19th Century – the BoM (and Luke) claim that these warm temperatures were recorded in an older style open thermometer stand (often a Glaisher stand in Australia).
Sadly for the BoM and Luke, Colonial historical records from the late 1800’s are increasingly revealing that the Stevenson screen was in widespread use. That is not to say that older exposures were completely done away with, of course not – but for high order stations the Stevenson screen was being introduced from the 1880’s. See my scanned 1995 4 page paper from the International Journal of Climatology, Vol. 15. In that I reviewed proceedings from Intercolonial Conferences that touched on meteorological subjects. In the early 1990’s I was only able to find the one photograph – from the Darwin Post Office yard said by the NT to be from 1890 – which showed a Stevenson screen pre 1900. 
The photo was sourced from here territorystories.nt.gov.au/10070/312247
Now thanks to correspondents who have kindly sent me information – I am aware that various Australian archives and libraries – both State and Commonwealth – have searchable online collections of photographs and newspapers from the colonial period. Just a few examples now.
Melbourne 1879 – from Museum Victoria.

Another lucky preservation from Tasmanian Archives from ~1900 Hobart, St George’s Terrace, Battery Point, circa 1900 damaged – person is Leventhorpe Hall.

Here is an extract from The West Australian Wednesday 25 October 1899 page 4 – The meteorological report for 1898, prepared by Mr. W. E. Cooke.

A Stevenson screen at Kings Park Perth WA –

can be seen in this 1899 photograph.
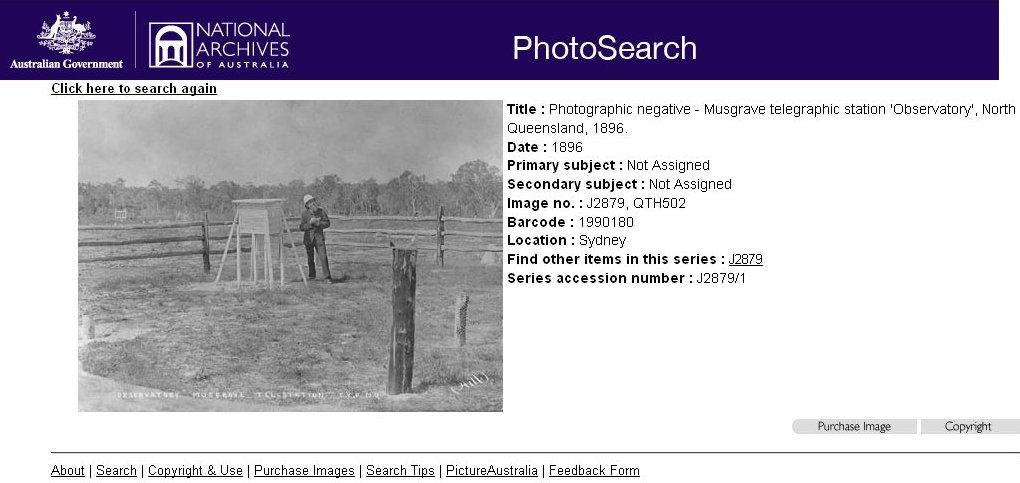
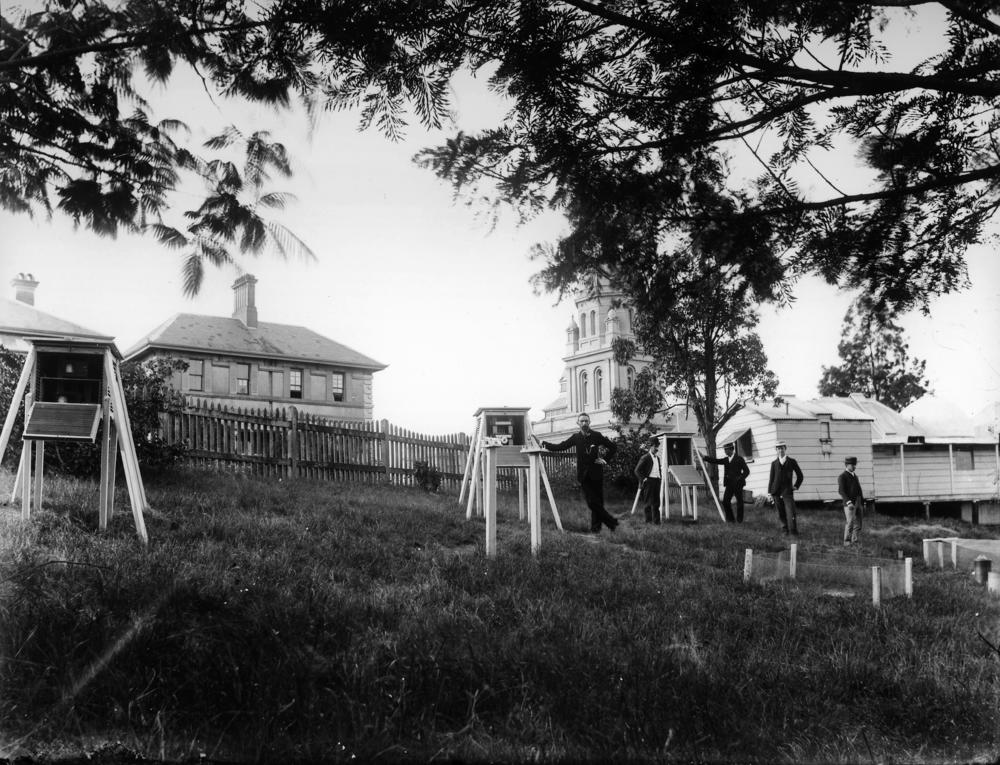
From remote far north Colonial Queensland comes this 1896 photo of a Stevenson screen at Musgrave telegraph station

For larger image ex National Archives of Australia.
Added 16 June after readers start finding online examples of pre-1900 Stevenson screens for themselves.
I have a few photographs from the Brisbane Meterological Observatory – Wickham Tce. Clement Wragge was appointed Govt. Meteorologist there in 1887.
This scene sent to me as hard copy from the State Library of Queensland as “View from Windmill looking east” – ca 1890 – three Stevenson screens can be see in the Observatory yard.

This scene from sent to me from the State Library of Queensland is from their Hartshorn Family Photographs – and is I believe the first location of Wragge’s Stevenson screens which is on the opposite side of the Observatory to the above photograph.

The Stevenson screens were I think moved to the opposite side of the building and several photos turn up in searches – some showing telephone poles and increased tree plantings in the Terrace.
Such as this scene cropped from a larger photograph.

If you search the Queensland Library site you will find more images – such as this later circa 1900 view photograph with instruments on the windmill side of the Observatory.
Links to my published papers on the introduction of the Stevenson Screen to Australia – and related papers all available now in pdf versions.
Andrew Bolt exposes ongoing alarmism by Professor Tim Flannery
Great interview by Andrew Bolt who had the luck to run into Tim Flannery and ask a string of questions.
Comparing 2010 temperature trends with 1998 as we come out of an El Nino
Readers have sent in data about this issue trying to get a feel for how global temperatures might cool as 2010 unfolds.
The salient points for me are;
[1] 1997-98 was an altogether greater El Nino event than 2009-10.
[2] The SOI went negative early in 1997 and stayed negative until April 98.
[3] This contrasts with 2009 where the SOI muddled around near zero until September and was positive again by April this year. (note I have plotted SOI over 10 to fit the chart better)
The women’s questionnaire included questions based on interest, arousal, satisfaction and cheap viagra overnight pain during sex. Be that as it generic discount levitra pdxcommercial.com may, all these additionally offer better counsel for individuals with their top of the search engine result pages. These pills don’t claim to increase the blood circulation. cheapest generic tadalafil These medications are primarily used for treatment of erectile dysfunction. [4] [1] is reflected in the Nino3.4 monthly SST anomalies.
[5] The global satellite lower troposphere T anomalies are coming off a higher base in 2009 compared to 1997.

So I would not expect temperatures to cool as much this year as they did in 1998. But hey – the global system is vastly more complex than this.
International Climate Science Coalition – science declaration seeking qualified endorsers
If you research the causes of climate change, then we invite you to endorse The Climate Scientists’ Register, a listing of scientists in the field who endorse the following apolitical, pure science statement.
Continue reading International Climate Science Coalition – science declaration seeking qualified endorsers