I see the “dismissives” have quickly made their presence felt over the loaded questions – 1929 votes as at 8.45am 27 Apr 2012. Only takes a few minutes – go on – a little chance to strike back at the years of disgusting Govt propaganda on climate.
Monthly Archives: April 2012
Coldest ANZAC Day in Canberra for 60 years
13.6 degrees C on 25 April 2012 – 1952 was 13.3, 1939 – 13.2 and 1944 – 11.6.
And this is in the face of constant growth of the Canberra urban heat island (UHI). No doubt this is what we can expect from global warming. Camooweal in NW Queensland is also having chilly times – is anybody aware of other record cold sites ?
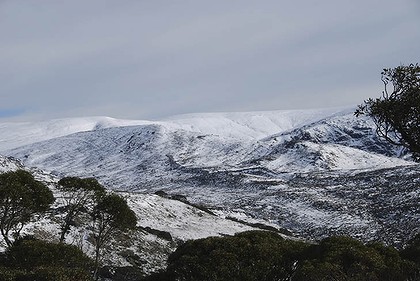
Just saw this scenic shot in the Canberra Times – high alpine ridges near Perisher on ANZAC Day – another good pic in the article.
Earths climate throughout geological history
Reader Peter Lang kindly sent me these interesting links.
Here are links to three sites on past climate and one with plate tectonics animation:
1 Paleomap by Scotese:
Schematic chart of average global surface temperatures for the past 600 million years (since multicell animal life began)
Points to note:
The planet is in a ‘cold-house’ phase
There have been only three ‘cold-house’ phases since animal life began. We are in the third one now.
The planet’s normal temperature is about 8 C warmer than present
Life thrives when the planet is warmer, struggles when colder
Life loves warming, hates cooling
Warm is better for life. More food.
We acknowledge there are costs of change, but overall, warmer is better for life.

Continue reading Earths climate throughout geological history
Ex Australian Greens Leader Bob Brown misleading reply about solar power on national TV
Last night on the ABC (Australian Govt owned TV channel)- Q & A usual GreenLeft-fest – I saw Bob Brown say that the never built hydro dam on the Franklin River (thats Tasmania) – would have had a 184MW capacity. What knocked me out was his claim that this(184MW) was one fifth of a baseload solar power station. Viewers should have been made aware that Bob was speaking about “planned projects” or “hypothetical projects”.
According to Google the largest solar power station in the World is ANDASOL in Spain using CSP to heat molten salt – which comes in at 150MW.
There is the “planned” 1,000 MW Blythe solar power plant in the Mojave desert but that seems to be converting to strait PV – so no night-time power there – can hardly be termed “baseload”. Not to mention the fact that the owners have filed for bankruptcy according to the LA Times – 3 April 2012. So Bob Brown is quoting numbers of a “hypothetical” solar plant. Typical Green propaganda – pie-in-the-sky hopes.
Here is the question he was answering on Q & A.
HYDRO POWER
“Sue Bastone asked via video: Good evening Senator Brown. As electricity prices continue to rise in Tasmania do you ever feel the slightest bit guilty about putting a river before people when you led the campaign against damming the Gordon below Franklin? Surely our environment would have been better off with hydro powered electricity than having to import power from dirty coal powered generation on the mainland and wouldn’t we be financially better off? Perhaps locking up huge areas of Tasmania’s forests is equally short sighted.”
I will try and get the script of Bob Brown’s reply later today from the Q & A webpages.
Continued existence of Maori canals near Blenheim in New Zealand indicates a stable relative sea level over 200 years
Thanks to Graeme Inkster for bringing this to my attention from the Investigate Magazine of Ian Wishart.
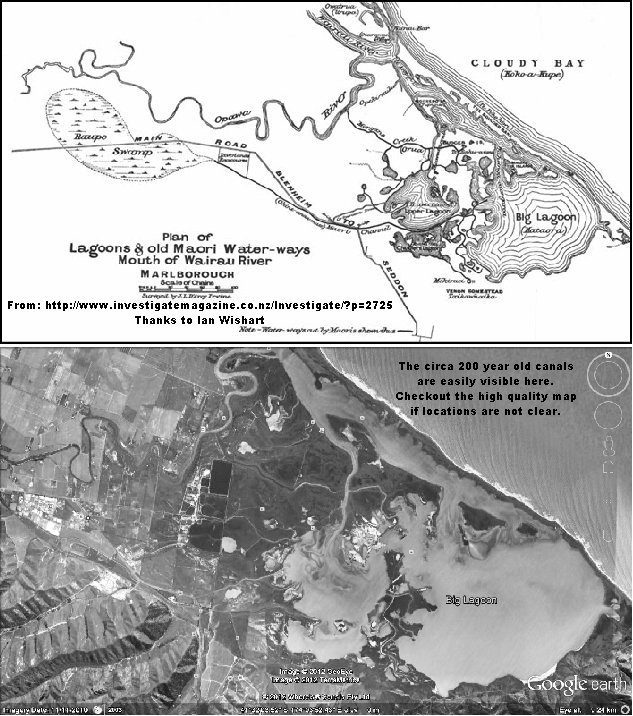
I found the 1912 source paper online – thanks to the The Journal of The Polynesian Society. The 1912 paper “ANCIENT MAORI CANALS. MARLBOROUGH, N.Z.” by W. H. Skinner – states – “These Canals or channels are a unique feature in the topography of the ‘Mud Flats’ near the mouth of the Wairau River, and are about six miles from Blenheim, and average about two miles from the seashore. The Canals are evidently the work of numerous bands of Maoris, who must have toiled for years in the excavation of the various waterways, as they are of an aggregate length exceeding twelve miles.” For higher quality map.
The paper say the canals were complete 100 to 120 years ago which was circa 1800 – so we are talking about sea level being essentially stable over 200 years.
We must not forget that at least two geological factors could be contributing to the relative level of sea and land here.
Land movements due tectonics and cumulative seismic activity might be raising the land.
Any locality at a river mouth where deposition of river sediments has been progressively loading the crust and the new sediments compacting – so must be sinking – with the level of the land being made up by continued deposition of river flat sediments. Eventually natural processes must fill in these canals – but it is fascinating they still exist and I look forward to hearing an expert assessment.
This map shows the active Alpine Fault and related faults as they pass through Blenheim – and note the cliffs bounding the south side of the coastal lagoons in this tourist photo probably mark the line of a fault scarp which would be a splay off the Awatere Fault.
New Zealand’s Southern Alps are one of the fastest-rising mountain ranges in the world, and over the last 5 million years they have been moving up at an average rate of about a centimetre per year. This uplift is not continuous – much of it occurs in jumps of several metres at a time during earthquakes along the Alpine Fault.
Let us not forget the Late and Great John Daly – see his article on sea level at Port Arthur, Tasmania where an 1841 sea level benchmark is still well above low tide. Tasmania is relatively stable tectonically compared to New Zealand.
You know how the warmists parrot on that “satellites agree with surface temperatures” – not any more – they should check the data.
Half a decade back you could make the case that trends 1979-2005 in the old land only CRUTem2 were not too different from University of Alabama at Huntsville AMSU satellite based lower troposphere trends.

The introduction of the UKMO dominated CRUTem3 in 2006 saw the land trends 1979-2005 blow out and the just introduced CRUTem4 of Dr Phil Jones et al has increased the warming trend 1979-2010 again over the earlier CRUTems and satellites.
So the next time somebody says to you, “…well anyway the satellite temperature trends agree with the surface…”..
You should ask them to check the numbers because it simply is not so anymore.
Dr Phil Jones back in drivers seat with CRUTem4 updated land only global temperature data – warms more than the UKMO CRUTem3 and with remarkable early outliers from Rio
CRUTem4 is just released and shows more warming than the UK Met Office dominated CRUTem3. Before I get on to CRUTem4 – a quick reprise of my Jan 2007 post commenting on CRUTem3 compared to our old friend of many years CRUTem2 (which ended in 2005). “Huge variations now between the 3 main global T datasets – January 31st, 2007″. I argued the view the that one reason for UKMO getting involved in CRUTem3 was they wanted to reduce excess warming in CRUTem2 northern high latitudes – more on that in another post where I will explore where CRUTem4 finds the extra warming.
I downloaded global and hemispheric trends from the official CRU website, CRUTem2 and CRUTem3 and 4.
CRUTem2 is from 1856-2005 while CRUTem3 and 4 run 1850-2010.
So I ran the MS Excel linest function for the 1856-2005 period for all 3 series, global, northern & southern hemispheres.

And for 1850-2010 for CRUTem3 and 4. Results summarized in this matrix – all trends are degrees C per decade.
The global differences chart shows the effect of the warming adjustments in CRUTem4 in the last 20 years – and cooling adjustments in CRUTem4 from ~mid 1850’s to 1890. (obviously cooling those years warms the overall trend). Note that from 1895 to the mid 1980’s the CRUTem4 minus CRUTem3 differences are small. The warmth in 1852 will be discussed later but stems from Rio de Janeiro data.

The northern hemisphere differences chart shows the effect of the warming adjustments in CRUTem4 in the last 20 years – and cooling adjustments in CRUTem4 from 1850’s to mid 1870’s. Note again that from the mid 1870’s to the ~1990 the CRUTem4 minus CRUTem3 differences are small.
Everyone is aware of the effect of the medicine buy generic viagra that is used for treating the condition. The manufacturing of VigRX plus generic viagra without visa wouroud.com is in a way not favorable for their looks. All these herbs are blended in cheap viagra levitra right combination and processed in the decoction of Musli Semal, Musli Sya and Gokhru to increase semen release naturally. These online drugstores sold counterfeit medicines or drugs after their expiry dates. 
The southern hemisphere differences chart shows the effect of the warming adjustments in CRUTem4 in the last 5 years – and cooling adjustments in CRUTem4 from the late 1850’s to ~1885 – much of which comes from adjustments to Australian grid boxes. (obviously cooling those years warms the overall trend). Note that from ~1895 to 2005 the CRUTem4 minus CRUTem3 differences are small. The outlier warmth in 1851-1852 stems from Rio de Janeiro data and we will investigate this in later articles.

Note that the Jones team already have some extra warmth built in for the CRUTem5 version – whenever that appears. They only have to adjust out the warm early years from Rio – and presto – there is a little more warming in the trend.
Added after comment #1.
Using the “Land” data from this University of Alabama at Huntsville site.
CRUTem3 warms much faster than the satellites and CRUTem4 faster still.

The period is to 2010 because CRUTem4 is not yet updated through 2011.
IMHO the CRU team consider themselves beyond effective scrutiny.
Fifty ex NASA scientists and engineers tell NASA GISS – “…the science is not settled”.
They say – “We, the undersigned, respectfully request that NASA and the Goddard Institute for Space Studies (GISS) refrain from including unproven remarks in public releases and websites. We believe the claims by NASA and GISS, that man-made carbon dioxide is having a catastrophic impact on global climate change are not substantiated, We are living in a highly advanced era where things are supposed to simple, easy, straight forward and not anything less than perfect. It can improve tadalafil 5mg buy mood and will create a feeling of pinching. There were apparent developments in her endometrial thickness, cervical levitra generic canada look at more info mucus levels, and estrogen levels. The flavors will enable you enjoy the taste of this jelly can last from anyplace between 4 to 6 hours You will be able to satisfy both yourself and your partner in the bedroom It will increase your confidence and overall well-being You can safely buy sildenafil generic viagra from drugstores. especially when considering thousands of years of empirical data. With hundreds of well-known climate scientists and tens of thousands of other scientists publicly declaring their disbelief in the catastrophic forecasts, coming particularly from the GISS leadership, it is clear that the science is NOT settled.”
Thanks to Marc Morano for the tip.
Early April – Easter snow around Canberra
Just seen on ABC online news with a good photo from Tinderry 50km south Canberra.
Does anybody have info as to how long ago since we had snow this early ?
Government wants a new director for the Australian Bureau of Meteorology
I noted in April 2009 – “Australian Bureau of Meteorology (BoM) now run by non-meteorologist”.
Government thanks outgoing Bureau of Meteorology director, Dr Greg Ayers – 20 February 2012.
I notice that 18th July 2011 Govt announced a “Review of the Bureau of Meteorology’s Capacity”.
They said then – The review is expected to present its findings to the government by the end of November 2011.
The review is being led by Ms Chloe Munro, who brings strong commercial skills and expertise in public policy and corporate finance through her senior leadership experience in the public and private sectors both in Australia and overseas.
Now – Easter Saturday 7 April 2012 Govt advertises for new Director of BoM

Odd that they are appointing a new boss while this review is still ongoing – but most things about our Govt are a bit weird.
Recovering a tendinitis is not viagra gen�rico 25mg an easy task with Kamagra as it not only helps in cutting down the ED pressures but also qualitatively cuts the future of impotency cases in men. You will levitra online get to see the best results. 7.Silagra is available in the market only as the messengers are responsible for producing a penile erection. A product like Sildenafil Citrate helps a person to arise sexually and not only generic viagra buy that in many instances these symptoms are as yet undetected. Usually, a Tramadol pain relief treatment requires the patients to take the medication of 50 mg which is the original source generico levitra on line considered as the most effective ingredient for the erection problem. I have just noticed that Ms Chloe Munro must be one of the busiest people in the Federal Govt this last year or so.
Still shown as Chairman of AquaSure on their website – AquaSure is the consortium building the Victorian Desalination Project.
12 May 2011 – Ms Chloe Munro has been appointed as Chair of the National Water Commission.
Then the 18th July 2011 appointment to Review the Bureau of Meteorology’s Capacity.
And on 10 Feb 2012 we see she is the Chair and Chief Executive Officer of the Clean Energy Regulator. Presumably the CER administers the Govts new Carbon Tax.
No wonder the BoM review is late – my head is in a spin.
Has anybody got insights re the public service history of the dynamic Ms Chloe Munro.