BoM says, our National daily max temperature record is SA, 50.7, 2 January 1960 Oodnadatta Airport 17043
www.bom.gov.au/climate/extreme/records.shtml
Just over a year ago Onslow in WA equalled the 50.7 see my blog – “BoM equal record hot day at Onslow a nothing-burger 14Jan2022” www.warwickhughes.com/blog/?p=6850
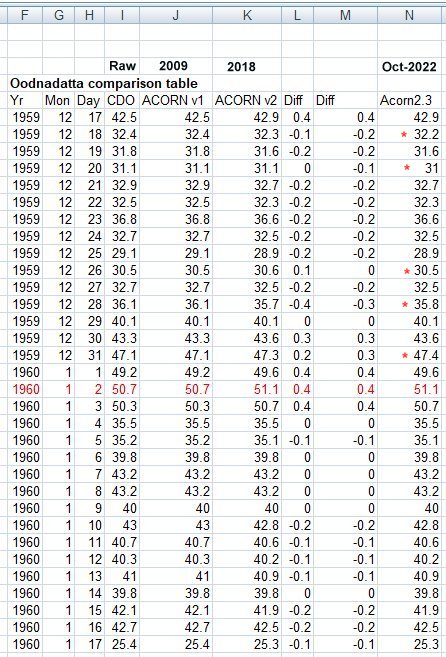
My table comparing four versions of Oodnadatta daily max from 17Dec1959 to 17Jan1960 shows 4 columns of daily max – CDO (Climate Data Online) referred to be some as Raw, the original ACORN from 2009 which shows no changes from CDO, Acorn V2 from 2018 and ACORN V2.3 from Oct 2022. There are two columns of differences, the first is ACORN V2 minus ACORN 2009, the second is ACORN V2.3 minus ACORN V2.
I have marked with red asterisks the five days in 1959 where ACORN V2.3 is different to ACORN V2.
www.warwickhughes.com/agri16/oodna-various-acorns.jpg
What a debt of gratitude we owe BoM for the $multi-millions of dollars they spend correcting for the poor eyesight of the Oodnadatta weather station custodian in 1959-1960.
Monthly Archives: January 2023
Sydney enjoys 323 days under 30 degrees in our largest UHI
2022 ended up cooler than normal towards the end see Chris Gillham’s great www pages –
Australian climate cooling since 2012.
www.waclimate.net/australia-cooling.html
And today Sydney Observatory Hill just recorded over 30 degrees – read about the significance at Weatherzone.
www.weatherzone.com.au/news/sydney-ends-nearrecord-run-below-30-degrees/1050804
Sydney ends near-record run below 30 degrees 18Jan23. Quote [ Prior to today, Sydney’s last day above 30ºC was on February 21, 2022, meaning the city just had 331 days between temperatures over 30ºC.
This is the city’s second longest gap between 30ºC days in records dating back to 1859. The only longer period between 30ºC days lasted for 340 days, between December 31, 1882, and December 6, 1883.]
Weatherzone also note at the end of their article – Quote[Considering Sydney’s near-record run of days below 30ºC in the broader context of climate change makes it an even more impressive feat for the city. Observations from Observatory Hill show that the city’s mean annual maximum temperature has increased by around 1ºC between 1910 and 2021.]
How stunning that they would “touch their forelock” to “climate change” but not mention the location in the largest urban heat island in all the wide brown land.
2023 In Australian is starting cool but what else is due this year? Will add to this post later.
BoM says La Nina is easing yet SOI is strongly positive
The ABC is running this article today “La Niña is rapidly easing, the BOM says. But the prospect of El Niño has some worried. So what’s next?” Sorry WordPress does not let me put a link in.
www.abc.net.au/news/2023-01-06/is-el-nino-next-after-la-nina-bom-climate-driver-forecast/101828686
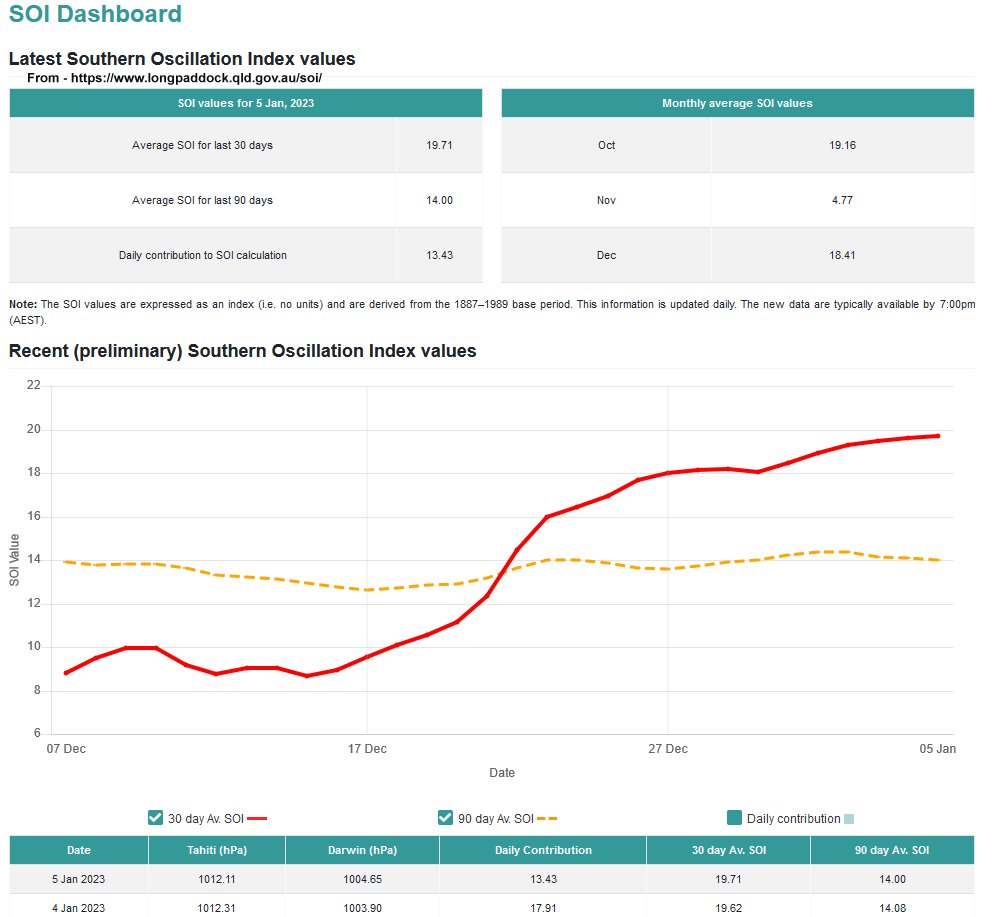
Yet Longpaddock has the 30 day SOI at +19.7 while the 90 day SOI is steady near +14.
www.longpaddock.qld.gov.au/soi/
I realise BoM are looking at more indicators than the SOI. Time will tell.
Here is my screen save of the SOI on 5Jan23 – paste these URL’s into a new TAB if that suits you.
www.warwickhughes.com/agri16/SOI-month-5jan23.jpg
ABC sucked in by obvious rainfall errors at Muja Power Station a BoM site
Our GreenLeft ALP/ABC has an interesting article on Australian rainfall during our often wet 2022.
Raining champs – Records fell up and down Australia’s east coast as rains, floods and insurance payouts all hit new peaks. As we welcome back the sun to our lives in 2023, what should we do to prepare for the next big wet? – Casey Briggs 31Dec22 – www.abc.net.au/news/2022-12-31/australian-weather-rain-2022-records-broken-flooding/101789262
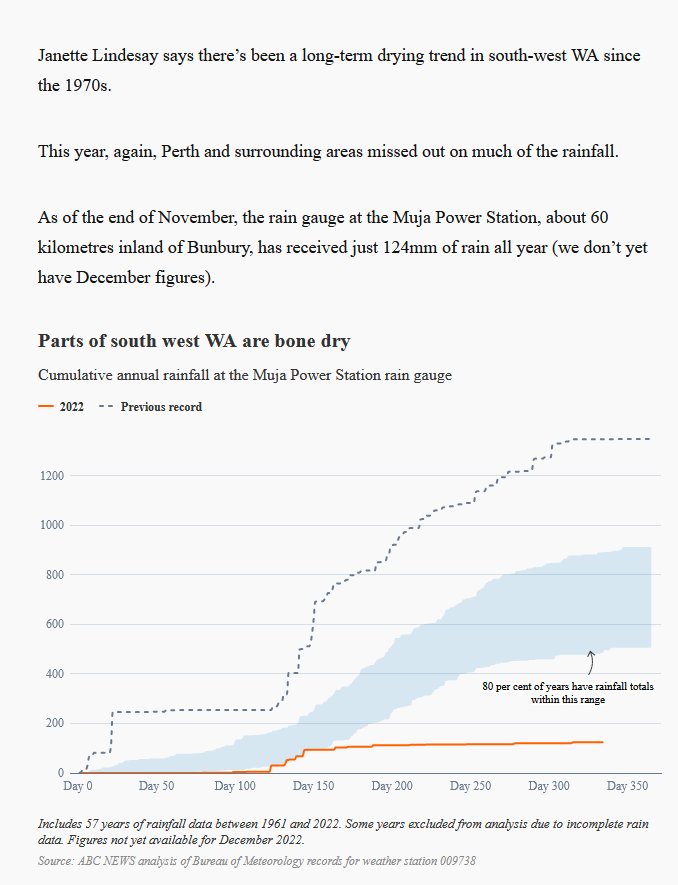
There are plenty of interesting graphics and photos to help us reprise 2022. Here and there through the article there are quotes from Professor Janette Lindesay, a climatologist at the Australian National University. About 2/3rds down their page we come to a map in shades of greens a greys preceded by text saying – “This map shows you how much wetter 2022 has been. We’ve taken data from nearly 1,000 weather stations, to map out how different this year’s rain is from the median of the past 30 years.” You see parts of SW WA are in a grey zone which means [10% dryer than …the median of the past 30 years”. Reading down under our grey and green map we see a quote by Professor Janette Lindesay “Janette Lindesay says there’s been a long-term drying trend in south-west WA since the 1970s.” Moving down the ABC says “This year, again, Perth and surrounding areas missed out on much of the rainfall.” Yet Perth Metro recorded 700.2mm in 2022 which is only 36.6mm under the annual mean. The ABC goes on “As of the end of November, the rain gauge at the Muja Power Station, about 60 kilometres inland of Bunbury, has received just 124mm of rain all year (we don’t yet have December figures).” Beneath that are two charts headed by “Parts of south west WA are bone dry – Cumulative annual rainfall at the Muja Power Station rain gauge” This graphic
www.warwickhughes.com/agri16/ABC-Muja-rain31Dec22.jpg
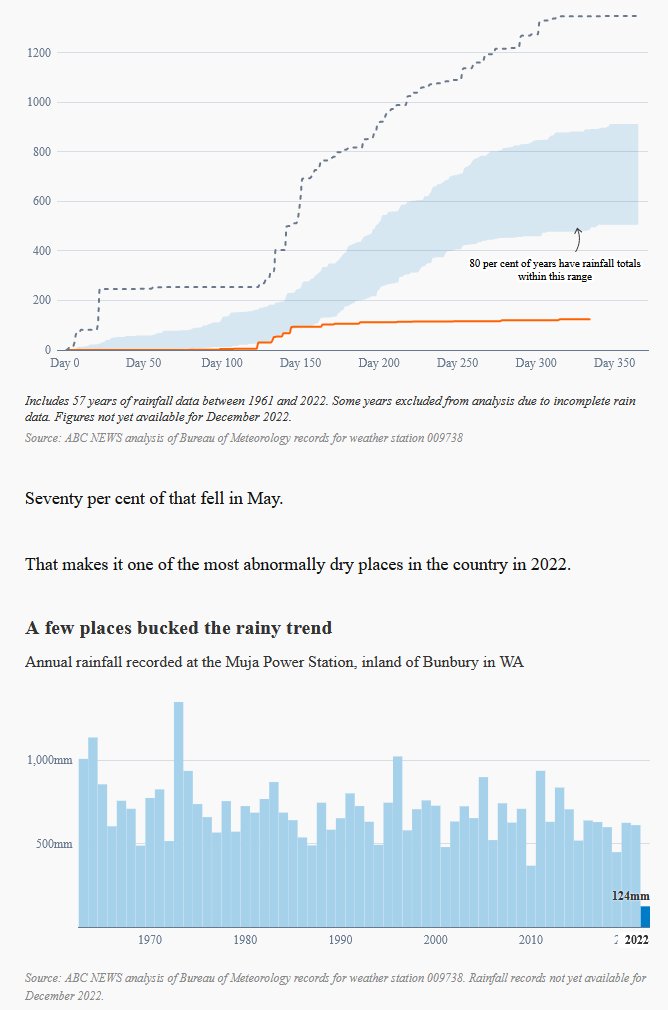
and the chart underneath shows how BoM rainfall data from Muja Power Station BoM #9738 has only recorded 124mm rain for 2022. www.warwickhughes.com/agri16/ABC-Muja-rainb31Dec22.jpg
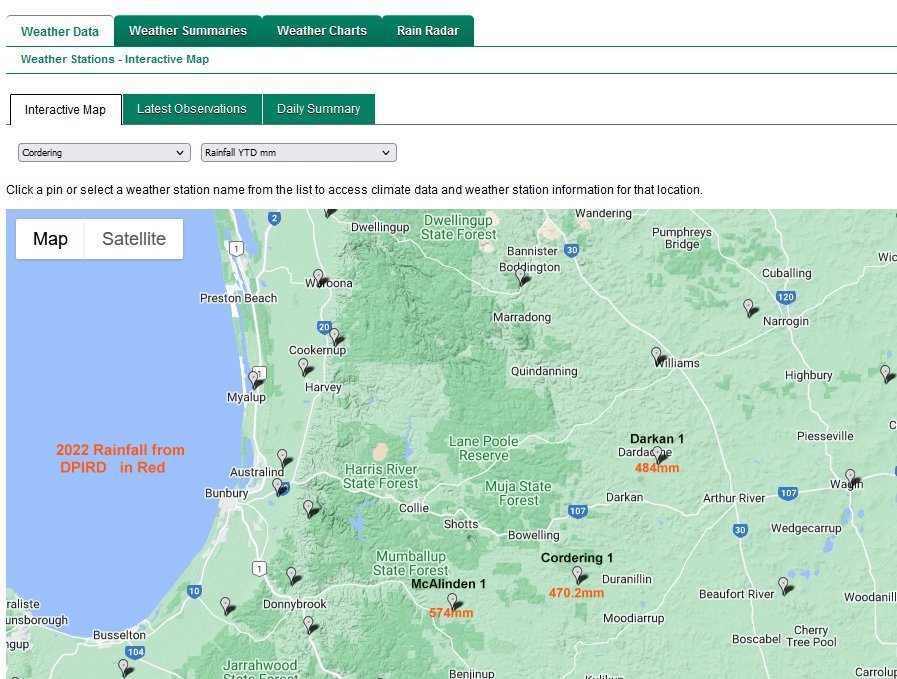
I have checked rainfall from surrounding BoM and WA DPIRD gauges and those data offer no support for the notion that Muja Power Station BoM #9738 can be relied upon. Here are links to two Collie/Muja district maps annotated with 2022 rainfall, one from BoM -https://www.warwickhughes.com/agri16/BoM-Muja-district-rain2022.jpg
and the other from WA DPIRD.- www.warwickhughes.com/agri16/DPIRD-map.jpg
Remember the WA DPIRD has a separate network of weather stations indie of BoM.
You can make various 2022 rain maps now at this BoM page –
www.bom.gov.au/climate/maps/rainfall/?variable=rainfall&map=totals&period=12month®ion=wa&year=2022&month=12&day=31
Below here hoping to show screen save of Muja Siteinfo pdf page 9 re rain gauge failing performance tests in 2011 – see comments below
