We have all seen very recent headlines from last week beating up BoM warnings of a “brutal summer”.
See my 5 screensaves

Yesterday ABC obediently walked back some of BoM’s above enthusiasm of last week – publishing a map showing Australia enjoyed mainly average summer rainfall during the last 13 notable El Ninos (see screensave 5 at above ibb link).
You could not make this up – rush out scary stuff during the week then walk it back on Saturday.
Ready for round two? El Niño and positive Indian Ocean Dipole to deliver more spring heat 23sep23
www.abc.net.au/news/2023-09-23/nsw-national-weather-wrap-september-23/102883448
Category Archives: Water
Albo tips more Fed taxpayers $’s into Tassie Hydro on Fathers Day
Marinus Link deal reworked to keep undersea power cable project between Victoria, Tasmania alive 3Sep23
www.abc.net.au/news/2023-09-03/marinus-link-undersea-cable-costs-renegotiated/102808504
Albo tips more Oz tax $'s into Tasmanian "Battery of the Nation" cue laughter – financing the Marinus undersea link to Vic rejigged with Albo paying more reports ABC on Fathers Dayt.co/OIQt1TeXSZ pic.twitter.com/fBU8hxfOR9
— Warwick Hughes (@IPCC_Errs) September 4, 2023
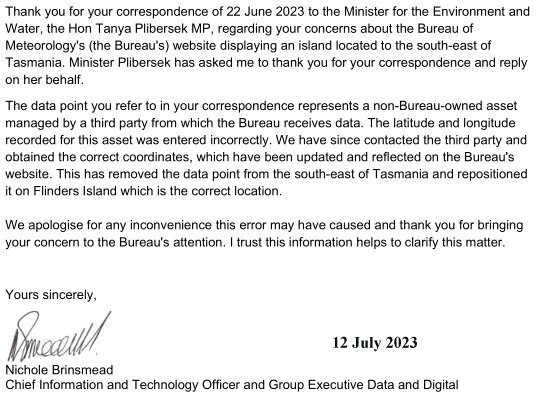
BoM reply to me solves mystery Tasmanian island with rain-gauge
Wow a rare event to report – BoM sends me a sensible email communication – chalk that one up.
Around 19Jun23 I noticed a mystery Island was showing SE of Tas on BoM www rainfall maps where by colour coded dots they portray rain gauge readings over the last 48 hrs.
www.bom.gov.au/australia/flood/index.shtml
I Tweeted this on the 19th –
Australian Bureau of Meteorology discovers a new Tasmanian Island – YeeHa!! pic.twitter.com/3mRqdJOT4q
— Warwick Hughes (@IPCC_Errs) June 19, 2023
thinking this would find its way to BoM and they would quickly fix their html error.
I have been away from Twitter for several years and restarted after Musk bought in.
I know nothing about the finer points of tweeting.
If any reader knows of some useful www “tweeting for dummies” please pass on.
When after a few days the “island was still showing” on 22 June I emailed Minister Plibersek who has BoM under her wing.
My email got the usual “machine acknowledgement” and I noticed Mystery Island disappeared on 28Jun, I tweeted this.
Australian Fed Gov BoM Bureau of Meteorology takes two months to correct an html glitch causing a fake island with rain gauge to show SE of Tasmania.
~60 risings and settings of the sun and no staffer noticed the elementary error in Aussie geography. t.co/hDUurGnAR3 pic.twitter.com/mtWMpreAxi— Warwick Hughes (@IPCC_Errs) June 28, 2023
Mystery Island reappeared on 29th and vanished again on 30th.
Then yesterday a reply came in from BoM – click for jpg copy.
warwickhughes.com/agri16/BoM-reply-mystery-Tas-island-12jul23.jpg
I have difficulty remembering a more sensible and to the point reply from BoM and I am wondering if Minister Plibersek possesses some magical powers she can assert over BoM.
Perth exceeds June rain in first 10 days
Checkout totals against AWN “Normal” here
www.australianweathernews.com/data/DS1_09.HTM
As I write totals are only to the 9th and there may be a few more mm to add for the 10th.
More later
AWN Oz page www.australianweathernews.com/recent_AWN_daydataCurrentMonth_station.html
Back in March I blogged
SW WA rainfall the arm-waving Gov misinformation continues as BoM closes or neglects rainfall stations
www.warwickhughes.com/blog/?p=7120
Several subjects to be covered/touched on/updated in this important contested area flooded with Gov funded misinformation.
I listed issues A to H all very much alive.
BoM Canberra radar still inaccurate after big overhaul
BoM announced recently that their Canberra(Captains Flat) radar was offline –
Quote[This radar is undergoing routine maintenance and will be offline from
15/05/2023 to 24/05/2023 – Reason: Technical or equipment problems Date: 15/05/2023
Start time: 7:30 am EST Duration: 226 hour(s) Estimated time of restoration of service: 24/5/2023 5:30 pm EST]
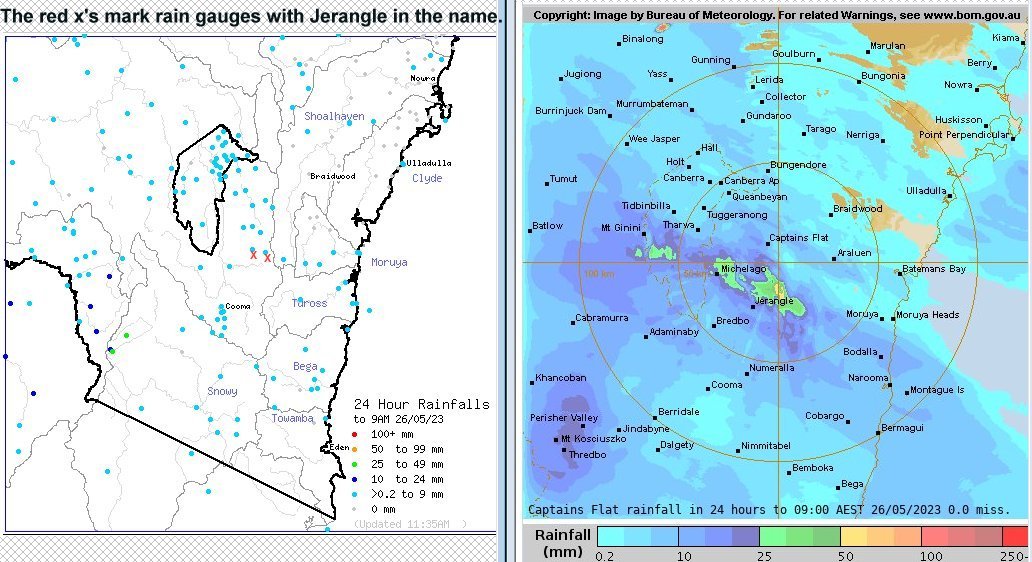
Now the Canberra(Captains Flat) radar is back on duty but I see huge errors for the 24hrs to 9am 26May.
My twin screensaves comparing – BoM radar estimated rain vs BoM and NSW Gov rain gauge rain show the main belt of “dogsballs errors” around Jerangle. www.warwickhughes.com/agri16/Jerangle-radar-rain-errors26may23.jpg
On the rain gauge map I have marked with 2 red X’s the stations with Jerangle in the name – not the slightest sign of rain in gauges anywhere near 25mm
SW WA rainfall the arm-waving Gov misinformation continues as BoM closes or neglects rainfall stations
Several subjects to be covered/touched on/updated in this important contested area flooded with Gov funded misinformation.
A – The usually reliable Dwellingup 9538 failed to record rain on 31March when radar shows ~50mm fell.
www.bom.gov.au/products/IDW60801/IDW60801.94620.shtml
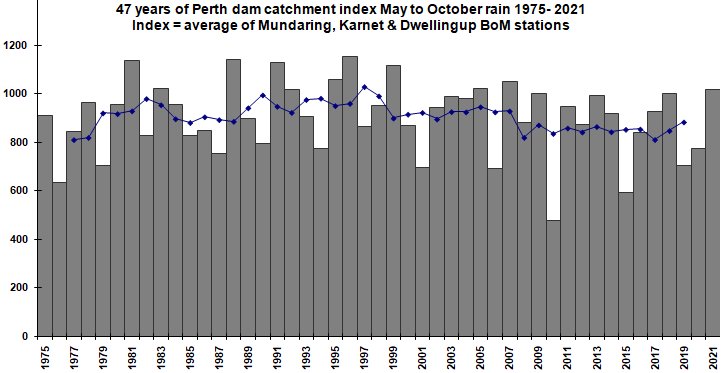
Long term readers here should know that over a decade ago I constructed my “Perth Dams Catchments May-Oct Rainfall Index” series from three stations – Mundaring Weir 9031, Karnet 9011 and Dwellingup 9538. In recent years BoM has discontinued Mundaring Weir 9031(see C below) so I have replaced that with Mundaring 9030. I have been well aware that Karnet 9111 has been getting worse and may have to look for an alternative site (see B below). My last update of my “Perth Dams Catchments May-Oct Rainfall Index” series is to year 2021 and I still have to do the work to update 2022.
2021 update 47 years Perth dams catchment May-Oct rain index 4Aug2022
www.warwickhughes.com/blog/?p=6960
Here is best link to my full 2021 chart.
www.warwickhughes.com/agri16/per-dams-catch-index2021.jpg
B – The patchy and unreliable Karnet 9111 turned in an obviously gappy & incomplete 2022 total. Seemingly accepted by BoM.
www.bom.gov.au/jsp/ncc/cdio/weatherData/av?p_nccObsCode=136&p_display_type=dailyDataFile&p_startYear=2022&p_c=-16612931&p_stn_num=9111
Why Karnet 9111 should be so unreliable I fail to understand as it is near a State run prison where there would be no shortage of labour to reliably curate rainfall gear.
I might have to include the well curated Bickley 9240 into my “Perth Dams Catchments May-Oct Rainfall Index” series to replace Karnet.
C – BoM has killed off in recent years several unreliable rain stations down the line of Perth dams – see previous blog
BoM chooses not to explain Perth dams faulty rainfall data 23Jul2018
www.warwickhughes.com/blog/?p=5871
D – All the above & below subjects mesh with my Muja blog where I expose the “barking mad” claim by ABC/BoM/ANU Academic that Muja Power Station 9738 rainfall was really as low as 124/127mm for calendar 2022.
ABC sucked in by obvious rainfall errors at Muja Power Station a BoM site 1Jan2023
www.warwickhughes.com/blog/?p=7061
E – The ever GreenLeft Our/ABC after Christmas 2021 published this arm-waving twaddle –
Why WA’s south-west is drying out at one of the worst rates in the world 28Dec21
www.abc.net.au/news/2021-12-28/why-south-west-wa-is-drying-out/100625142
And for your interest while on the subject of “arm-waving twaddle” – I see these glossed-up wild claims.
Guided by nature – Indigenous Australians use their deep spiritual connection to the land to track the seasons, but elders are warning of a “massive shift” in climate. 31Mar23
www.abc.net.au/news/2023-03-31/indigenous-australian-seasons-guided-by-nature/100919396
F – I have various blogs and www pages over more than a decade exposing the WA Gov and Water Corporation dodgy claims that rainfall decline has caused streamflow into dam catchments decline. In fact decades of neglect of scientific “control or thinning of excessive catchment bush” is the main cause of any runoff decline.
No water shortage forced seawater desal on Perth 27Feb2018
www.warwickhughes.com/blog/?p=5608
see link to – There never was a rain shortage to justify seawater desalination for Perth’s water supply 4Dec2007
www.warwickhughes.com/blog/?p=145
BoM March23 rain Outlook many fails
BoM rain Outlook for March
www.bom.gov.au/climate/ahead/outlooks/archive/20230223-outlook.shtml
Note dry NSW mid-west – wet NSW coast – note the dry near Mt Isa and belt east of Longreach – note dry Wagin-Perth – wet Hobart
Now lets check reality – Australian rain percentages for the month to date
www.bom.gov.au/climate/maps/rainfall/?variable=rainfall&map=percent&period=cmonth®ion=nat&year=2023&month=03&day=28
You can home in on States for greater detail.
To try and put the best spin on their many Outlook fails they helped the GreenLeftABC with this cluster-of-excuses.
Rain douses dry predictions for autumn with storm spell predicted to peak this week 29Mar23
www.abc.net.au/news/2023-03-29/autumn-weather-australia-storm-spell/102155924
Dirty drinking water in Narrandera??? an iconic NSW Govt monster fail
With a NSW State election due in 2 days this ABC story highlights a long term failure – the magnitude of which is difficult to convey without Shakespearian word skills.
Plus a State Govt now anti-dam. Only One Nation would be reliably in favour of building dams.
‘Dirty’ tap water in Narrandera is causing diarrhoea and rashes, residents say 23Mar23
www.abc.net.au/news/2023-03-23/narrandera-water-dirty-complaints-sick-residents/102129344
Will add more here later but check my “Water” category on the left.
46 Sydney Harbours in 12 months Murray R. flows to SA
The ample MDB rains of 2022 following two good years have lead to the 46 Sydney Harbours (23,377GL) flowing into South Australia.
www.bom.gov.au/climate/maps/rainfall/?variable=rainfall&map=percent&period=12month®ion=md&year=2022&month=12&day=31
This eye watering volume of fresh water has originated as rainfall. The MDB is ~1million sq km so if 500mm rain fell on average in 2022 that is 0.5GL x 1million or 500,000 GL or 1,000 Sydney Harbours of rainfall.
Now there is evaporation, soakage into the ground, recharging of acquifers, filling dams of all sizes, as these colossal floods move on their pathways over the MDB landscape and make their way to the Murray R.
The Minister for the Environment and Water Tanya Plibersek is still demanding NSW & Vic waste more water to the sea by way of Environmental Flows agreed to years ago. Water ministers fail to agree on way forward as Murray-Darling Basin Plan deadline looms 24Feb23
www.abc.net.au/news/2023-02-24/states-fail-to-agree-as-murray-darling-basin-plan-deadline-looms/102018886
Four months ago I blogged –
MDB floods widespread but GreenLabor planning huge enviro flows 31Oct2022
www.warwickhughes.com/blog/?p=6989
I said then [The Minister seems to be gloating about stopping previous Gov dam projects, already stalled in antidam State bureaucracies, and using the $Bns to buy water out of the MDB plan for future flushing down to the sea.
Making the MDB a smaller & less important future food-bowl and the wide brown land will be a weaker food producer.]
I also blogged before Christmas 2022 –
So irrigation is only 1% of the Murray–Darling Basin!!! 22Dec22
www.warwickhughes.com/blog/?p=7050
Thats 1% of the area.
Auckland floods spark climate change claims
We have probably all seen TV or www news of the Auckland floods of a week ago tomorrow.
I have assembled the links below and also listed points A to F to provide some perspective.
No news items mention basic facts that –
[A] – Rain gauges were very sparse in the 1800’s and pre-WWII compared to today.
[B] – Unbuilt vegetated land and natural bush that would have soaked up rainwater and impeded water flow was much greater in area in the 1800’s.
[C] – Tarmac, roads and buildings that increase the rate of runoff were greatly less in the 1800’s and pre-WWII.
[D] – It would be doubtful that custodians of the few rain gauges in the 1800’s and pre-WWII were systematically noting rain over periods shorter than one day.
[E] – So making claims about recent rain when we have dozens and dozens times the rain gauges now than we did in the 1800’s risks conclusions that are unscientific.
[F] – Research into early newspaper archives should reveal reports of rainfall causing floods which may add to data to compare with recent times.
Auckland sets new all-time daily rainfall record – Jess Miskelly, 28 Jan 2023, 1:07 PM AEDT
www.weatherzone.com.au/news/auckland-sets-new-alltime-daily-rainfall-record-/1069729
Three people dead and at least one missing as rain pounds Auckland 28Jan23
www.abc.net.au/news/2023-01-28/three-people-dead-one-missing-as-rain-pounds-auckland/101903134
New Zealand’s north island hit by flash floods, landslides for third day, as death roll rises to four 29Jan23
www.abc.net.au/news/2023-01-29/auckland-starts-clean-up-after-deadly-flash-floods/101904116
More heavy rain expected for New Zealand’s flood-ravaged Auckland 31Jan23
www.abc.net.au/news/2023-01-31/more-heavy-rain-expected-for-new-zealand-s-flood-ravaged-aucklan/101910300
Auckland’s historic flooding explained in five charts 31Jan23 by Marc Daalder
www.newsroom.co.nz/sustainable-future/aucklands-historic-flooding-explained-in-five-charts
It could have been mentioned re the last chart that the UHI(Urban Heat Island) effect would be adding to warmth in Auckland.
Marc Daalder is to be congratulated for venturing into the subject area of charting rainfall data which is rarely seen in the main-stream-media.
Good on you Marc. However it is a shame NIWA took 1965 as a starting point when I bet Kiwis have been recording rainfall for at least a 100 years before that.