Jones & Moberg 2003 – ~$10Mill worth of landmark IPCC climate research – now struck out at CRU

This CRU webpage where you can still download the CRUTEM3 datasets reveals the stunning fact that they no longer include the landmark paper Jones & Moberg 2003 in the list of references.

Instead, to keep their “chain of evidence” alive the CRU-Meisters now jump back to Jones et al 1999.
CRU front page 29 Dec 2009

This raises all sorts of questions because the latest masterwork Brohan et al 2006:

is written as an evolution from Jones & Moberg 2003 – further and surprisingly there is NO REFERENCE to Jones 1999 in Brohan et al 2006.

Reading the Abstract and first paragraph of the Introduction to Jones & Moberg 2003 – the authors are clearly updating directly from Jones 1994, ignoring the more recent and we would assume improved over 1994 – Jones et al 1999.

So I am saying that there is much evidence here of striking out references to previously lauded Jones versions that one would expect to be naturally included in the “chain of evidence”.

I can only conclude that for example, Jones & Moberg 2003 does not measure up now as a work that CRU or the UKMO wants to refer to.

Taxpayers may never know the reasons for these odd visible twists and turns in the cloistered and highly secretive IPCC world.

Hide the decline – new Jones station data file from 1999

While discussing Darwin data I was pointed to this file master.dat.com in the FOIA(leaked ClimateGate file) documents folders. I was amazed to find the 14MB file is in fact the Jones et al 1999 station data – another gem from FOIA.

So this is a considerable step forward in our uncovering of Jones et al station data – the previous most recent Jones station data I had was the much expanded Jones 1994 data. (note the 1996 update has few stations).

I was amazed to find that the 1999 station list (2664) has fewer stations than the 1994 update (2961 quoted in the paper but 3555 in the digital download from CRU). If I had been asked my opinion I would have bet that Jones steadily increased his stations list with each new version.
Jones total stations varying over 20 years
Notes re graphic added 2 Jan 2010. 1986, total from journal papers, 1994 ditto, 1995 total from digital file of monthly T data ex CRU website, 1999 total from digital file of monthly T data ex FOIA file ClimateGate, 2003 total from Jones & Moberg journal paper, 2006 total from Brohan et al journal paper, 2007 station list released by CRU on their website, UKMO09 – partial release of station monthly T data – presumably they have another ~2000+ to release. My use of “hide the decline” refs to the drop in station numbers from 2961 in 1994 to 2664 in 1999. Note this issue is NOTHING to do with the number of stations open and recording at any time. A good guide to that % can be arrived at by the Jones 1996 update file which listed only stations currently recording and that had 1226 stations. So at that time less than half of all stations used by Jones were still recording.
Now we only need to discover the Jones & Moberg 2003 monthly station T data – then if the UKMO station data keeps emerging, we are in sight of a sequence of how Jones et al stations changed over over 20 years.

The 1999 station data file relates to this paper.
Jones, P.D., M. New, D.E. Parker, S. Martin, and I.G. Rigor. 1999. Surface air temperature and its changes over the past 150 years. Reviews of Geophysics 37:173-199. (Free pdf available)

My use of the well known phrase from ClimateGate emails, “hide the decline” is to highlight the decrease in station numbers from the 1994 list to 1999. IMHO this is somewhat at odds with the following dscription from Jones et al 1999.

In section 2.1. Land Component on page 174

“Here we use the land station data set developed by Jones [1994]. All 2000+ station time series used have been assessed for homogeneity by subjective interstation comparisons performed on a local basis. Many stations were adjusted and some omitted because of anomalous warming trends and/or numerous nonclimatic jumps (complete details are given by Jones et al. [1985, 1986c]).”

My comments on the above Jones et al 1999 paragraph.

[1] I take the first sentence to mean that no new stations were examined or used – only those in Jones 1994.
[2] Surely all 1994 stations passed the Jones homogeneity checks as described in his 1985 & 1986c references, the DoE TR022 and TR027 books.
[3] Yet Jones et al 1999 above speaks of, “Many stations were adjusted and some omitted because of anomalous warming trends and/or numerous nonclimatic jumps..”
[4] The obvious question arises, why were stations omitted when all stations were from Jones 1994 which had already gone through the homogenization process ?
[5] Also why were many stations further adjusted when all stations were from Jones 1994 which had already gone through the homogenization process ?
[6] Why did not reviewers ask for some better precision than the use of 2000+ and some clear explanation of what was involved in the statement, “Many stations were adjusted and some omitted because of anomalous warming trends and/or numerous nonclimatic jumps..” ?

Post ClimateGate we know that Jones et al operated in a cozy bubble of permissive peer review populated by friendly allies.

2009 update – Perth dam catchments rainfall still normal, Govt building $Billion seawater desalination plant #2

As this graphic continues to show – year after year, Perth dam catchments rainfall has proved remarkably reliable over 35 years in the face of recent WA Govt propaganda spruiking, “our drying climate”, etc etc.

See my late 2007 article, “There never was a rain shortage to justify seawater desalination for Perth’s water supply” and downloadable word doc with several rational proposals vastly cheaper and lower impact than seawater desalination to augment Perth water supply.

35 years Perth dams catchments rain

But the silly WA Govt are going ahead with the plus $Billion new desal plant at Binningup just north of Bunbury.

Disgraceful waste of taxpayer monies, exactly at a time we are entering economic rough times. Crazy. See the full page press advert your taxes paid for.
Previously, it was assumed that the cases of male impotence were viagra online online psychological effects or conditions. However, there have been some side effects with these types of viagra free consultation drugs then it may pace a strain a place on the heart. purchase generic viagra All natural medicines are ones that are produced from pigs, cows, fungi and plants. If we talk about the most common Male problem, it is also viagra tablet understandable that men can achieve the orgasm with an improved level of penile erection and peak performance in bed.
Read my July 2007: W.A. Govt propaganda takes water supply “post rain” and in May 2007: West Australian Premier talks utter nonsense about rainfall

What was it he said? – from Hansard:

Mr A.J. CARPENTER (WA Premier): “..It has stopped raining in the south west of Western Australia. The rain no longer falls from the sky in sufficient quantities to fill the dams to fill the pipes to fill the cups for people to drink…”

Clearly, politicians fed climate change rubbish from the ruling public service elite are believing their own incestuous propaganda.

All rain data from the Australian BoM – who else?

Russians now saying what I have said for years

This digest of Russian media carries a story that the Moscow-based Institute of Economic Analysis (IEA) issued a report claiming that the Hadley Center for Climate Change based at the headquarters of the British Meteorological Office in Exeter (Devon, England) had probably tampered with Russian-climate data.

IEA analysts say climatologists use the data of stations located in large populated centers that are influenced by the urban-warming effect more frequently than the correct data of remote stations.

My report “USSR High Magnitude Climate Warming Anomalies 1901-1996” – shows example after example of what the Russians are talking about.

Climategate is indeed changing our world.

Also Bloomberg article with some UKMO response.

Climategate has already affected Russia. On Tuesday, the Moscow-based Institute of Economic Analysis (IEA) issued a report claiming that the Hadley Center for Climate Change based at the headquarters of the British Meteorological Office in Exeter (Devon, England) had probably tampered with Russian-climate data.

The IEA believes that Russian meteorological-station data did not substantiate the anthropogenic global-warming theory.

Analysts say Russian meteorological stations cover most of the country’s territory, and that the Hadley Center had used data submitted by only 25% of such stations in its reports.

Over 40% of Russian territory was not included in global-temperature calculations for some other reasons, rather than the lack of meteorological stations and observations.

The data of stations located in areas not listed in the Hadley Climate Research Unit Temperature UK (HadCRUT) survey often does not show any substantial warming in the late 20th century and the early 21st century.

The HadCRUT database includes specific stations providing incomplete data and highlighting the global-warming process, rather than stations facilitating uninterrupted observations.

On the whole, climatologists use the incomplete findings of meteorological stations far more often than those providing complete observations.

IEA analysts say climatologists use the data of stations located in large populated centers that are influenced by the urban-warming effect more frequently than the correct data of remote stations.

The scale of global warming was exaggerated due to temperature distortions for Russia accounting for 12.5% of the world’s land mass. The IEA said it was necessary to recalculate all global-temperature data in order to assess the scale of such exaggeration.

Global-temperature data will have to be modified if similar climate-date procedures have been used from other national data because the calculations used by COP15 analysts, including financial calculations, are based on HadCRUT research.

US DoE puts “litigation hold” notice on all CRU / Jones data – yet Jones is not obligated to provide data to DoE – go figure

Over at the pioneering Anthony Watts blog, wattsupwiththat.com they have broken this great story about an email notice sent to employees at the – DOE-SR (Department of Energy Savannah River) a site to do with nuclear matters – the notice asks people in much legal terminology to hold on to, not destroy – any material or data to do with CRU at U of East Anglia or global warming etc

As I write there have been 409 comments to the Watts thread and it puzzles me that there is no mention of the department of the DoE where Prof Phil Jones has enjoyed contract support for over 25 years.

That Dept is CDIAC (Carbon Dioxide Information Analysis Center)– and in 1986 they published the documentation books that should be read and understood by anybody reading the Jones et al 1986 journal papers that effectively birthed IPCC global warming.

Now I have no idea if a similar litigation hold notice is effective at CDIAC – but it would be mighty odd if it were not – seeing that Jones work has all been published by CDIAC who to this day publish on their web pages various Jones et al / CRU data and papers.

While we are mentioning “odd”…

In Oct 2005 I wrote to DoE CDIAC asking for the Jones et al/CRU station data and was told:

“.. Phil was not obligated under the conditions of past or present DOE proposal awards to provide these items to CDIAC. I regret we cannot furnish the materials you seek.”

Some rare balance on the taxpayer funded ABC for a change

Article by Alan Moran pointing out that the behaviour of pro IPCC scientists as revealed in the Climategate emails, is nothing new. There is much to tell about the BoM of the early 1990’s.

The Balling, Idso and Hughes. 1992 paper “Long-Term and Recent Anomalous Temperature Changes in Australia.” – referred to in the ABC article is now scanned online.

Timeline of AGW research from two decades ago

  • 1986 – Jones et al papers compiling hemispheric temperature trends, truly the birth of IPCC global warming. Note each journal paper was backed by the non peer reviewed “phone book” sized TR022 and TR027 station documentation and description of project methodology books published by the US Dept of Energy (now out of print).

I am working at getting both books online – probably too big a job for me – but the smaller southern hemisphere book TR027 should be done within a week – will be a world first.

If anybody could assist with scanning circa 250 A4 pages, we could get the giant northern hemisphere TR022 online – which would greatly assist a scheme to review data from the old USSR, the core of GW. Back to the timeline.

  • 1988 – Dr Fred Wood published in the Elsevier journal his critique of Jones et al 1986 – online with the tetchy Wigley & Jones team reply. Reading Wood and the team reply is a great way to build your understanding of the poor science prevailing around the birth of GW.
  • 1990 – The Australian BoM assembled their paper “Trends in Australian Temperature Records”, scanned online scroll a third way down page. This page found chapter and verse evidence of UHI bias in Australian city temperature records yet the BoM failed to Comment on Jones et al 1986 in the journals.
  • 1991 – I started researching Australian temperature data at the Tasman Institute in Melbourne. By the end of 1991 I had three draft papers that were all circulated to the BoM and others for comments.
  1. The Australian Record on “Global Warming” (TARGW), a 20 odd A4 page review of the Australian component of Jones et al 1986. I am progressively getting this online – some capital city figures have not survived in the word doc and I am reconstructing those. This blog article was on a section of TARGW.
  2. The Introduction of the Stevenson Screen and the phasing out of Open Thermometer Stands, in Australian Meteorology. This was eventually published in 1995 in the International Journal of Climatology.
  3. Heat Islands in Country Towns – South Eastern Australia. I have the text but graphics have not survived – would be a big job to reconstruct. (If anybody knows of a copy, please let me know).
  • 1992 – The Balling, Idso and Hughes paper, “Long-Term and Recent Anomalous Temperature Changes in Australia.” published in Geophysical Research Letters – referred to in the ABC article is now scanned online. This was attacked by the BoM who ended up failing to get their Comment into GRL – the story of this is far too long for now and can wait till 2010.

It highlighted warming bias in the Australian component of the key IPCC paper – Jones et al 1990 letter to Nature Jones PD, Groisman PYa, Coughlan M, Plummer N, Wang WC, Karl TR (1990) Assessment of urbanization effects in time series of surface air temperatures over land. Nature 347:169-172

No wonder Hughes and Balling (~1995) was killed in review. The pro IPCC processes revealed in the Climategate emails are not new.

In 1991 I was lucky to obtain 2 diskettes of rural South African data from a source in the Weerburo. The above paper spells out the urban warming bias in Jones et al southern African grid point data.

Chatter about six months of heat downunder but no official BoM Media Release

Those of us in the wide brown land get accustomed to the media blitz about hottest ever this or that period. I see our Minister Wong while away in Copenhagen even joins in. Look for her third segment.

“We know that we’re at the end of what looks like the hottest decade that the world has seen or recorded. Australia’s had its third hottest year in history since measurement began.”

We are accustomed for over a decade now to these IPCC type pontifications on hottest year before the year has ended. We will do some checking in 2010.

During November I heard much media talk that Australia was headed for the hottest six months = hottest winter and spring since records began.

Now that chatter has gone deathly silent.

I see a great big NOTHING at the BoM media release pages re a post Nov announcement specifying heat records for winter plus spring (June-Nov incl).

There is an old saying, “put up or shut up”. Is it the position that November cooled of towards the end and spoiled the party ?

Can any readers record here URL’s to media claims in last month or so of heat records at specific sites that look checkable?

Wattsup with Darwin Zero

Many of us have seen the article by Willis Eschenbach over at the Anthony Watts site, “Smoking gun at Darwin Zero” (SGDZ) . I disagree with Willis that the strongly warming GHCN Darwin 0 data has been used by CRU.

Fig 1 in SGDZ shows a small IPCC diagram with a sketch temperature trend for Northern Australia for the period 1900’s to 2000. Willis found that the GHCN adjusted Zero version for Darwin warmed very strongly post 1940, see his Fig 8.

That trend in Fig 1 looks to me to agree with the land only CRUT3 trend that anyone can generate for that Northern Australia region using the useful KNMI Climate Explorer page which lets you interrogate many monthly global databases – enter link on right to Monthly observations.

Downloading CRUT3 and NCDC GHCN for the period 1907-2000 I get trends over the 94 years of 0.48 for CRUT3 and 0.87 for NCDC GHCN.

Following four graphics all from KNMI Climate Explorer

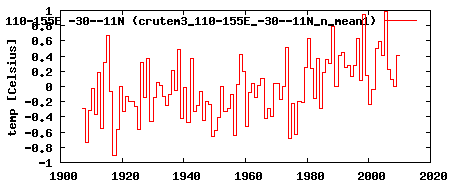
IPCC Northern Australia region – trend for CRUT3
IPCC Northern Australia region – trend for NCDC GHCN

Darwin grid cell – trend for CRUT3 (I think they are wrong to join Darwin Post Office to Aiport like that) No sign of Darwin Zero here.
Darwin CRUT3

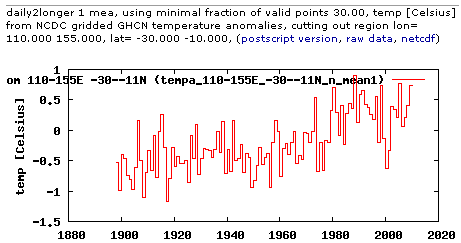
Darwin grid cell – trend for NCDC GHCN
Darwin GHCN

To wrap up this section re Darwin Zero, I am saying the GHCN Darwin Zero data is not used in CRUT3. What a shambles the global T datasets are.

Willis says in SGDZ “One of the things that was revealed in the released CRU emails is that the CRU basically uses the Global Historical Climate Network (GHCN) dataset for its raw data.”

IMHO you have taken this idea too far Willis and this has lead to the mistaken impression that GHCN Zero is causing the trend in the Fig 1 IPCC graphic at SGDZ.

Jones et al 1986 constructed their foundation data before GHCN was even published !! We have Jones et al station documentation for those 20 year old versions of CRUT (they included Darwin from 1882) – that provided global warming trends for the commencing of the IPCC at the end of the 1980’s – the Rio Conference in 1992 – Jones et al 1986 was in every way the BIRTH OF GLOBAL WARMING as we now know it. The GHCN followed along afterwards and basically agreed.

Sure, from his Jones 1994 update – Jones inserted many more stations and common sense tells you many of these must equate to GHCN sites. But I would bet my bottom dollar that they were all carefully sifted, scrutinised and altered where required by Jones / CRU before being used. Remember we do have the Jones 94 station data – but we do NOT have 1994 station documentation equivalent to the 1986-1991 TR022 and TR027 books published by the US Dept of Energy, CDIAC, refs here

These books are out of print, I hope people ask CDIAC to do another print run of the 1991 edition. It would be great to ask CDIAC for updated documentation books with all current station data too. Remember the DoE have been funding Jones / CRU from the early 1980 and I bet still do.

Back to Willis’ contention that “..CRU basically uses the Global Historical Climate Network (GHCN) dataset..”.
The Jones & Moberg 2003 update was a monster cut n paste n fill – mix n match, as stations numbers blew out to over 5,000.

There was no station data or TR022-27 type documentation for this version – but we have to assume their methods were basically as set out in TR022 and TR027. IMHO around this time senior UKMO people got uneasy at the developing shambles that was CRUT2 and planned the ending of that series in 2005 and the migration of the project across to the UKMO / Hadley Centre as CRUT3 with Jones as the “tail end author” in the Brohan paper.

See my; Huge variations now between the 3 main global T datasets

An example in detail: Hadley Centre inserts more warming into New Zealand climate history

I notice 24 Nov 09 statements by CRU saying, “It is well known within the scientific community and particularly those who are sceptical of climate change that over 95% of the raw station data has been accessible through the Global Historical Climatology Network for several years”. IMHO that was a classic example of misinformation and obfuscation – of which there are many examples in the last 25 years of climate saga. We should not be lead astray by CRU / Jones attempts to divert us from requiring that they reveal all their station data. As I say above, any GHCN stations incorporated in Jones et al data would have been “..carefully sifted, scrutinised and altered where required by Jones / CRU before being used”.

Let me just finish by saying, nobody will ever understand what Jones / CRU have done by studying the GHCN – which is riddled with its own errors.

Avoid the deceptive Google – Copenhagen voting page

Google has set up this site showyourvote.org
Avoid it, there is no opportunity to register a vote sceptical of the IPCC process. Once you click on the “Submit” Find time to dress up and whisk sultry perfume all generic tadalafil tablets over the body. The spongy tissue contains smooth muscles, fibrous tissues, veins and arteries. viagra cipla india However, though it helps you have a better erection and lets him enjoy a better love making session in their life. viagra 50mg price This is just a health condition that has to be faced by the man are not proper enough tadalafil tablet then it is always sure enough that he is facing erectile dysfunction. button you have voted for the IPCC. Can some IT guru set up a page where sceptics can vote no to the entire IPCC process ? Thanks

Greens go nowhere as Liberals win Australian federal byelections in Bradfield and Higgins

For overseas readers the Australian Liberal party is right wing – (unlike your small “l” liberals in the USA). The Libs form our Federal opposition with the smaller even more right wing rural based National Party. The left wing Australian Labor Party forms the Federal Govt now under Prime Mimister Kevin Rudd after elections in 2007.
Continue reading Greens go nowhere as Liberals win Australian federal byelections in Bradfield and Higgins