Less than a month ago 19 Sep BoM was saying El Nino would bring us a “..Summer of severe heat..”
We remember the “brutal summer” media blitz.

Contrary to BoM media is fact that in the almost month since BoM media heralding El Nino the SOI(Southern Oscillation Index) has turned to weaker negative readings closer to the neutral zone between El Nino and La Nina.

NOBODY!! knows what the SOI will do in the future, we can only follow the numbers as published.
Category Archives: BoM Australia
Weather Bureau for Australia
Oops Gov owned BoM instructs Gov owned OurGreenLeftABC to walkback brutal summer BS yakkayakka
We have all seen very recent headlines from last week beating up BoM warnings of a “brutal summer”.
See my 5 screensaves
Yesterday ABC obediently walked back some of BoM’s above enthusiasm of last week – publishing a map showing Australia enjoyed mainly average summer rainfall during the last 13 notable El Ninos (see screensave 5 at above ibb link).
You could not make this up – rush out scary stuff during the week then walk it back on Saturday.
Ready for round two? El Niño and positive Indian Ocean Dipole to deliver more spring heat 23sep23
www.abc.net.au/news/2023-09-23/nsw-national-weather-wrap-september-23/102883448
BoM and ABC beat up Australian “warmest winter on record”
Interesting that NASA satellites found the Australian lower troposphere cooler in August than July
www.drroyspencer.com/2023/09/uah-global-temperature-update-for-august-2023-0-69-deg-c/
www.warwickhughes.com/agri16/UaH-aust-Aug23
whereas the BoM adjusted ACORN mean temperatures found August way warmer than July see chart link below.
www.bom.gov.au/climate/change/?ref=ftr#tabs=Tracker&tracker=timeseries&tQ=graph%3Dtmean%26area%3Daus%26season%3D08%26ave_yr%3D0
Here is a BoM mean T anomaly map for August 2023 showing the red peak anomaly zone right through central wide brown land where there are few weather stations.
You could not make up BoM rubbish and add to that the changes to electric Pt resistance thermometers in recent decades all which can add to hotter readings.
www.bom.gov.au/jsp/awap/temp/index.jsp?colour=colour&time=latest&step=0&map=meananom&period=month&area=nat
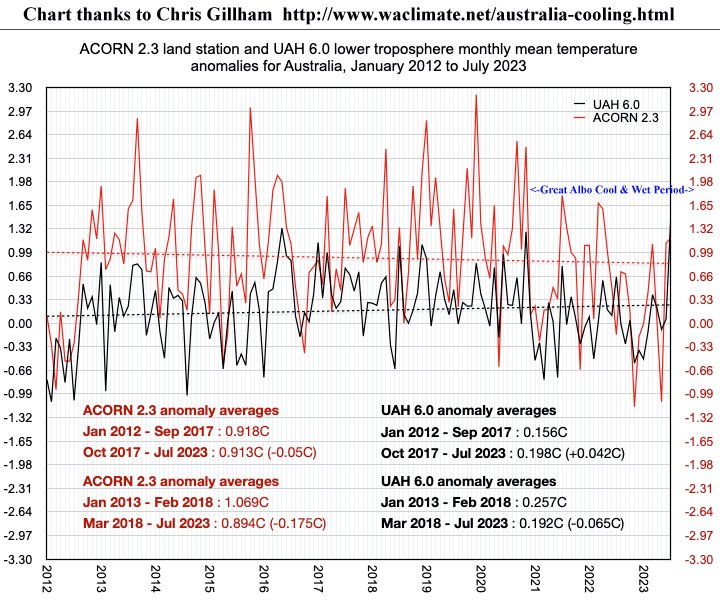
and see Chris Gillham’s updated monthly chart “Australian climate cooling since 2012” comparing BoM adjusted ACORN mean t with NASA satellites for Australia.
www.waclimate.net/australia-cooling.html
Warmer and drier spring forecast after warmest winter on record 31Aug23
media.bom.gov.au/releases/1177/warmer-and-drier-spring-forecast-after-warmest-winter-on-record/
Bureau of Meteorology confirms Australia’s warmest winter on record 1Sep23
www.abc.net.au/news/2023-09-01/bom-confirms-australia-s-warmest-winter-on-record/102804760
This map of the wide brown land mean T deciles for winter shows both Sydney and Canberra regions as “Highest on record” yet both sites had warmer winters in 2013.
www.bom.gov.au/jsp/awap/temp/index.jsp?colour=colour&time=history%2Fnat%2F2023050120230731&step=0&map=meandecile&period=3month&area=nat
Once again BoM maps not worth paper printed on.
Great Albo Cool & Wet Period in Australian mean temperature history
This chart of Australian Govt Bureau of Meteorology (BoM) ACORN V2.3 land station mean temperature series vs NASA lower troposphere satellites UAH, thanks to Chris Gillham, www.waclimate.net/australia-cooling.html
My annotation on Chris’ chart indicates the “Great Albo Cool & Wet Period” (GACWP)
www.warwickhughes.com/agri16/GACWP-Mk2-8aug23.jpg
Note Albo is the nick for our GreenLeft Australian Prime Minister Albanese. The GACWP starts after the heat of 2019 to the present day and has not ended. It will take a few months near 3 deg mean anomaly to end the GACWP.
Those of us who follow weather news would have noticed the effort BoM have been putting into talking up heat. Remember their “Heatwave” warning www page – sadly launched in the GACWP. BoM monthly data from here –
www.bom.gov.au/climate/change/?ref=ftr#tabs=Tracker&tracker=timeseries&tQ=graph%3Dtmean%26area%3Daus%26season%3D0112%26ave_yr%3D0
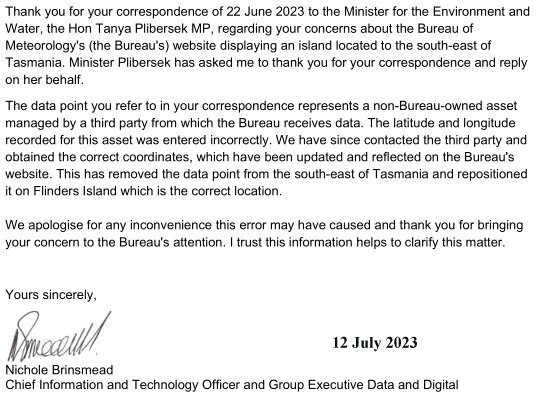
BoM reply to me solves mystery Tasmanian island with rain-gauge
Wow a rare event to report – BoM sends me a sensible email communication – chalk that one up.
Around 19Jun23 I noticed a mystery Island was showing SE of Tas on BoM www rainfall maps where by colour coded dots they portray rain gauge readings over the last 48 hrs.
www.bom.gov.au/australia/flood/index.shtml
I Tweeted this on the 19th –
Australian Bureau of Meteorology discovers a new Tasmanian Island – YeeHa!! pic.twitter.com/3mRqdJOT4q
— Warwick Hughes (@IPCC_Errs) June 19, 2023
thinking this would find its way to BoM and they would quickly fix their html error.
I have been away from Twitter for several years and restarted after Musk bought in.
I know nothing about the finer points of tweeting.
If any reader knows of some useful www “tweeting for dummies” please pass on.
When after a few days the “island was still showing” on 22 June I emailed Minister Plibersek who has BoM under her wing.
My email got the usual “machine acknowledgement” and I noticed Mystery Island disappeared on 28Jun, I tweeted this.
Australian Fed Gov BoM Bureau of Meteorology takes two months to correct an html glitch causing a fake island with rain gauge to show SE of Tasmania.
~60 risings and settings of the sun and no staffer noticed the elementary error in Aussie geography. t.co/hDUurGnAR3 pic.twitter.com/mtWMpreAxi— Warwick Hughes (@IPCC_Errs) June 28, 2023
Mystery Island reappeared on 29th and vanished again on 30th.
Then yesterday a reply came in from BoM – click for jpg copy.
warwickhughes.com/agri16/BoM-reply-mystery-Tas-island-12jul23.jpg
I have difficulty remembering a more sensible and to the point reply from BoM and I am wondering if Minister Plibersek possesses some magical powers she can assert over BoM.
BoM calls end of La Nina multi times
Interesting that BoM has been calling an end to La Nina for many months now – just check search engines for articles.
As I write – LongPaddock says the 30 day SOI is neutral again after being minus 19 in early June.
Canberra has coldest June morning for 36 years
Minus 7.2 is the coldest daily min for June at Canberra Airport since 1986
I have not found that the ABC www has reported this.
It flies in the face of what BoM said on 1st June.
The Bureau forecasts warmer and drier winter conditions for much of Australia 01/06/2023
media.bom.gov.au/releases/1169/the-bureau-forecasts-warmer-and-drier-winter-conditions-for-much-of-australia/
I notice Weatherzone skillfully confuses the issue with any month.
Ben Domensino, 21 June 2023, – Coldest morning in 5 years for parts of NSW, QLD, ACT
www.weatherzone.com.au/news/coldest-morning-in-5-years-for-parts-of-nsw-qld-act/1342232
The minus 7.2 flies in the face of the ever increasing Canberra urban heat island – just checkout recent developments near Canberra Airport.
Does not exactly back the warming meme that demands we commit to NetZero by whenever.
UKMO BoM Weather Observation Website going nowhere
Summary of UKMO BoM WOW pages
bom-wow.metoffice.gov.uk/
they say “Welcome to the Bureau of Meteorology Weather Observation Website The Bureau of Meteorology has collaborated with the UK Met Office so Australians may easily lodge and share weather observations, information and photos. Find out more about WOW and read the Bureau’s Disclaimer. For official Australian data, forecasts and warnings, go to www.bom.gov.au.”
There is a Blog or as they say a Forum.
groups.google.com/g/met-office-wow
And we find the first posts to the Forum were ~Aug 2013 and there were 111 posts and last post was in Oct 2018. So the public seems to have given up on WOW. I think it is clear from the URL that WOW was originally a UKMO idea – I guess BoM jumped on board and apart from the map of real time temperatures it all looks a bit like an unloved project now. Remember Climategate started in Nov 2009 so WOW was initiated by UKMO not long after dust was settling from Climategate which was a disaster for many many IPCC compliant National Met Office Orgs like UKMO and BoM.
A personal note here – WOW went under my radar till I heard about it in the last week or so on a sceptics email forum.
Perth exceeds June rain in first 10 days
Checkout totals against AWN “Normal” here
www.australianweathernews.com/data/DS1_09.HTM
As I write totals are only to the 9th and there may be a few more mm to add for the 10th.
More later
AWN Oz page www.australianweathernews.com/recent_AWN_daydataCurrentMonth_station.html
Back in March I blogged
SW WA rainfall the arm-waving Gov misinformation continues as BoM closes or neglects rainfall stations
www.warwickhughes.com/blog/?p=7120
Several subjects to be covered/touched on/updated in this important contested area flooded with Gov funded misinformation.
I listed issues A to H all very much alive.
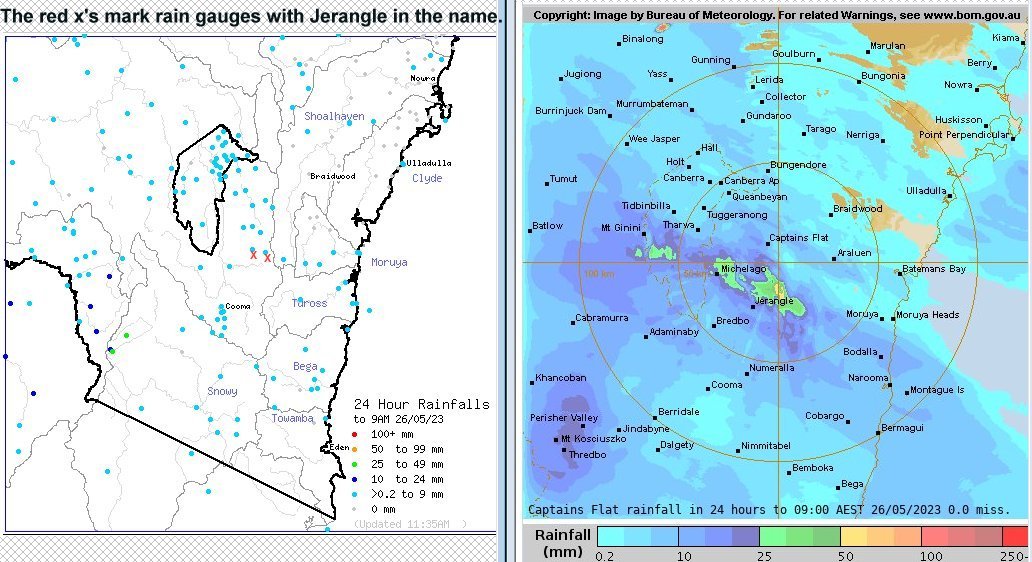
BoM Canberra radar still inaccurate after big overhaul
BoM announced recently that their Canberra(Captains Flat) radar was offline –
Quote[This radar is undergoing routine maintenance and will be offline from
15/05/2023 to 24/05/2023 – Reason: Technical or equipment problems Date: 15/05/2023
Start time: 7:30 am EST Duration: 226 hour(s) Estimated time of restoration of service: 24/5/2023 5:30 pm EST]
Now the Canberra(Captains Flat) radar is back on duty but I see huge errors for the 24hrs to 9am 26May.
My twin screensaves comparing – BoM radar estimated rain vs BoM and NSW Gov rain gauge rain show the main belt of “dogsballs errors” around Jerangle. www.warwickhughes.com/agri16/Jerangle-radar-rain-errors26may23.jpg
On the rain gauge map I have marked with 2 red X’s the stations with Jerangle in the name – not the slightest sign of rain in gauges anywhere near 25mm