Interesting that NASA satellites found the Australian lower troposphere cooler in August than July
www.drroyspencer.com/2023/09/uah-global-temperature-update-for-august-2023-0-69-deg-c/
www.warwickhughes.com/agri16/UaH-aust-Aug23
whereas the BoM adjusted ACORN mean temperatures found August way warmer than July see chart link below.
www.bom.gov.au/climate/change/?ref=ftr#tabs=Tracker&tracker=timeseries&tQ=graph%3Dtmean%26area%3Daus%26season%3D08%26ave_yr%3D0
Here is a BoM mean T anomaly map for August 2023 showing the red peak anomaly zone right through central wide brown land where there are few weather stations.
You could not make up BoM rubbish and add to that the changes to electric Pt resistance thermometers in recent decades all which can add to hotter readings.
www.bom.gov.au/jsp/awap/temp/index.jsp?colour=colour&time=latest&step=0&map=meananom&period=month&area=nat
and see Chris Gillham’s updated monthly chart “Australian climate cooling since 2012” comparing BoM adjusted ACORN mean t with NASA satellites for Australia.
www.waclimate.net/australia-cooling.html
Warmer and drier spring forecast after warmest winter on record 31Aug23
media.bom.gov.au/releases/1177/warmer-and-drier-spring-forecast-after-warmest-winter-on-record/
Bureau of Meteorology confirms Australia’s warmest winter on record 1Sep23
www.abc.net.au/news/2023-09-01/bom-confirms-australia-s-warmest-winter-on-record/102804760
This map of the wide brown land mean T deciles for winter shows both Sydney and Canberra regions as “Highest on record” yet both sites had warmer winters in 2013.
www.bom.gov.au/jsp/awap/temp/index.jsp?colour=colour&time=history%2Fnat%2F2023050120230731&step=0&map=meandecile&period=3month&area=nat
Once again BoM maps not worth paper printed on.
Category Archives: ACORN SAT
BoM latest Rolls Royce adjusted temperature series
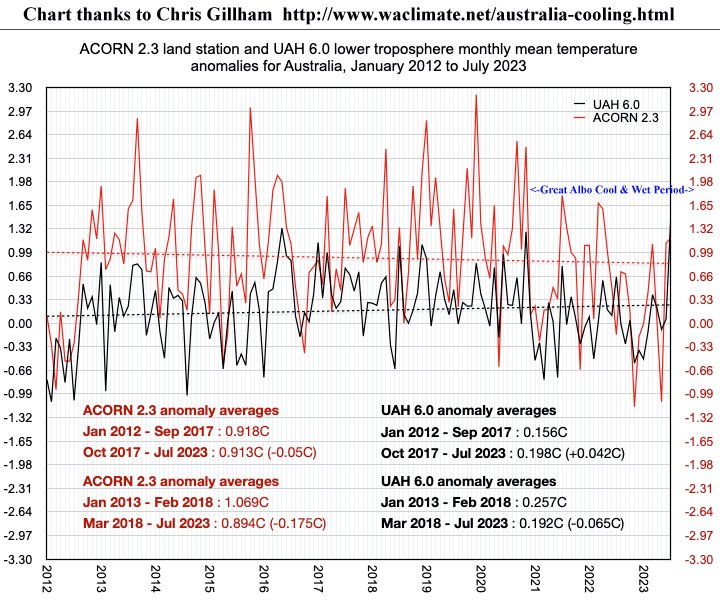
Great Albo Cool & Wet Period in Australian mean temperature history
This chart of Australian Govt Bureau of Meteorology (BoM) ACORN V2.3 land station mean temperature series vs NASA lower troposphere satellites UAH, thanks to Chris Gillham, www.waclimate.net/australia-cooling.html
My annotation on Chris’ chart indicates the “Great Albo Cool & Wet Period” (GACWP)
www.warwickhughes.com/agri16/GACWP-Mk2-8aug23.jpg
Note Albo is the nick for our GreenLeft Australian Prime Minister Albanese. The GACWP starts after the heat of 2019 to the present day and has not ended. It will take a few months near 3 deg mean anomaly to end the GACWP.
Those of us who follow weather news would have noticed the effort BoM have been putting into talking up heat. Remember their “Heatwave” warning www page – sadly launched in the GACWP. BoM monthly data from here –
www.bom.gov.au/climate/change/?ref=ftr#tabs=Tracker&tracker=timeseries&tQ=graph%3Dtmean%26area%3Daus%26season%3D0112%26ave_yr%3D0
Australian cool summer sparks massive headlines
Chris Gillham has updated his chart (Mar 2012 to Feb 2023) of ACORN V2.3 mean t(Aussie land stations many affected by UHI now stroked & tweaked by BoM) vs NASA UAH lower troposphere temps from satellites. His page is headed – Australian climate plateau since 2012 – Datasets show no warming for more than a decade
www.waclimate.net/australia-cooling.html
BoM three-monthly mean temperature anomaly for Australia 1Dec2022 to 28Feb2023
www.bom.gov.au/jsp/awap/temp/index.jsp?colour=colour&time=latest&step=0&map=meananom&period=3month&area=nat
At this BoM page you can also easily checkout the max anomaly (Daytime) and Min anomaly (Night time) maps.
This summer has been marked by amazing BoM publicity about heatwaves – perhaps readers can report their experience of heatwaves this summer – thanks.
In a few days the UAH Global map of lower troposphere T anomalies for Feb should appear at link below.
www.nsstc.uah.edu/climate/
BoM failure as specified by BoM
The raw articles for this whole blog idea have been provided for me by Lance Pidgeon AKA Siliggy around sceptic circles so it is mostly a guest post by him – thanks Lance.
On the 2nd of July 2017 the BoM weather station at Goulburn Airport recorded a very nippy morning and if you were quick at checking the BoM www page you might have been lucky to see minus 10.4 logged.
The story was told at the time by Dr. Jennifer Marohasy at her web site – “Bureau Erases Goulburn Record Minimum Temperature: Set Sunday 2 July 2017 – 4July 2017”
jennifermarohasy.com/2017/07/bureau-erases-goulburn-record-minimum-temperature-set-sunday-2-july-2017/
I chipped in after a few days with: – “BoM fiddling Goulburn minimum temperature 2nd July 2017 reveals extent of errors in BoM AWAP temperature maps 6Jul2017”
www.warwickhughes.com/blog/?p=5206
and I also blogged a wrap after a “month of BoM shooting itself in the foot” Wow – reminds me how sceptics made front page of “The Australian”
“Persistent truth telling climate sceptics cause the BoM to shaft itself again 1Aug2017”
www.warwickhughes.com/blog/?p=5246
Graham Lloyd’s well informed series of articles for years in “The Australian” critical of BoM gave the hypersensitive pompous bureaucracy plenty to hyperventilate to itself about. Add to that the truth-telling comments by climate sceptics high-lighting the Goulburn Airport and Thredbo July 2017 temperature reporting irregularities by BoM also reported by the press understandably lead to the apoplectic giant BoM setting up a 2017 “Review of the Bureau of Meteorology’s Automatic Weather Stations” by an international panel. The panel had five members – three from New Zealand and two from the BoM.
A pdf of the BoM’s 2017 “Review of the Bureau of Meteorology’s Automatic Weather Stations” can be downloaded here.
www.bom.gov.au/inside/Review_of_Bureau_of_Meteorology_Automatic_Weather_Stations.pdf
There must have been FOI requests for correspondence surrounding this 2017 review because two pdf’s of FOI30-6150 can be downloaded off the BoM www site – the newest by data is labelled Part1
www.bom.gov.au/foi/release/FOI30-6150_DocumentSet_ForRelease_Redacted_r_Part1.pdf
The oldest by date is labelled Part2.
www.bom.gov.au/foi/release/FOI30-6150_DocumentSet_ForRelease_Redacted_r_Part2.pdf
Both redacted pdf’s of the FOI30-6150 release are shown here
search.bom.gov.au/s/search.html?query=FOI30-6150&collection=bom&Submit=Search
along with the top URL “Disclosure Log” which is an interesting list of FOI material released by BoM since 2010. Plenty to research there.
www.bom.gov.au/foi/disclosure.shtml
Now to the meat of todays blog by Lance. If I add any point it will be [in brackets]
BoM tried to blame a faulty AWS but Lance points out how in the pdf doc ITR637 testing in 1994 at the makers “ALMOS” in the US – BoM only ever specified that AWS to record down to -10. Not colder than minus 10.!!
Lance text below here
From a Bureau of Meteorology FOI release the following internal email contents after the public had noticed temperatures not being recorded below -10.4 degrees.
“The equipment wasn’t faulty. The purchase specification required operation down to -10 ˚C, so the words need to be carefully written.”
Just how independant is this advice?
Page 77 of this PDF
www.bom.gov.au/foi/release/FOI30-6150_DocumentSet_ForRelease_Redacted_r_Part1.pdf
Where was this specified? I
A big clue is in this same BoM document mentioned on page 88 of the PDF. So hard to aquire it needed to be sent from New Zealand.
“Bruce Hartley has kindly forwarded ITR 637 summarising the tests on the AWS ADC cards.
The test results on P4 indicate that the 4-wire resistance measurement (which answers an
earlier question of mine) does not perform as well as might be expected”
And from that document we read;
“4. CONCLUSIONS
a) The performance of the resistance channels of the ALMOS AWS does not meet Bureau
Specification A2671 [1] requirement for electrical system accuracy over the full scale range of -10
to 55 °C.”
Here is that hard to obtain document. See attached. ITR637 INSTRUMENT TEST REPORT NUMBER 637 – Summary Report on ALMOS A.W.S. Tests – Jane Warne Senior Physicist Physics Laboratory BoM 21Oct1994
www.warwickhughes.com/agri16/ITR637.pdf
So the “full range” specified in A2671 was -10 to +55. When Australia had recorded much colder.
“Testing of the MSI1 card at the Bureau’s metrology area and the vendor’s facility in
1994 determined that the card would not report temperatures where the resistance
was equivalent to a temperature below –10.4°C. Subsequently, a new model card
(MSI2) was developed and procured from the vendor, with testing at the Bureau’s
metrology area in 1999 showing this card could operate accurately and successfully
at temperatures down to –25°C.”
www.bom.gov.au/inside/Review_of_Bureau_of_Meteorology_Automatic_Weather_Stations.pdf
Not only did problems pop up in Goulburn and Thredbo in 2017, with automatic weather stations being the primary instrument from late 1996, this problem was general until sometime after the mentiond 1999 test. ITR657 also attached.
Link to ITR657 INSTRUMENT TEST REPORT NUMBER 657
www.warwickhughes.com/agri16/ITR657.pdf
There are even odd accuracy specs mentioned in it.
Lance
[Later when I (wazz) have time there is much BoM pomposity to puncture in the two FOI30-6150 pdf’s – just now I lack the time but readers are welcome to post any examples that gets them laughing]
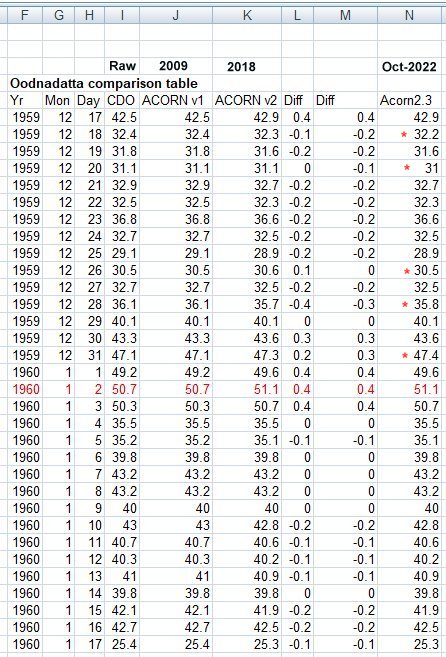
Our hottest ever day 50.7 degrees at Oodnadatta tweaked hotter by BoM’s ACORN series
BoM says, our National daily max temperature record is SA, 50.7, 2 January 1960 Oodnadatta Airport 17043
www.bom.gov.au/climate/extreme/records.shtml
Just over a year ago Onslow in WA equalled the 50.7 see my blog – “BoM equal record hot day at Onslow a nothing-burger 14Jan2022” www.warwickhughes.com/blog/?p=6850
My table comparing four versions of Oodnadatta daily max from 17Dec1959 to 17Jan1960 shows 4 columns of daily max – CDO (Climate Data Online) referred to be some as Raw, the original ACORN from 2009 which shows no changes from CDO, Acorn V2 from 2018 and ACORN V2.3 from Oct 2022. There are two columns of differences, the first is ACORN V2 minus ACORN 2009, the second is ACORN V2.3 minus ACORN V2.
I have marked with red asterisks the five days in 1959 where ACORN V2.3 is different to ACORN V2.
www.warwickhughes.com/agri16/oodna-various-acorns.jpg
What a debt of gratitude we owe BoM for the $multi-millions of dollars they spend correcting for the poor eyesight of the Oodnadatta weather station custodian in 1959-1960.
NSW cold records tumbling in mild start Australian summer
We knew as data came in for November that the BoM Australian mean temperature series ACORN 2.2 showed broad agreement with lower troposphere NASA satellite data from the University of Alabama at Huntsville as both showed a cooler period after 2020 – see chart by Perth based Chris Gillham of Scribeworks at waclimate.net/australia-cooling.html We know that Australia is experiencing its third consecutive LaNina and a few years of much rainfall and flooding. As December started there were BoM sourced media stories of heatwaves or forecast heatwaves but I am not aware of any heatwaves happening much. Links below in my comment as editing function is reduced in my main posts.
Surreal March BoM Temperature Outlooks compared to UAH satellites
UAH have finally brought out their global map of lower troposphere anomalies for March 2022.
The satellite brightness sounders found overall decidedly unremarkable temperatures from the lower troposhere (surface to approx 8kms) across the wide brown land.
The BoM March Outlook for max temperature (daylight) Predicted much warmer than UAH satellites measured.
The BoM March Outlook for min temperature (night time) Predicted HUGELY warmer than UAH satellites measured.
Then for another BoM comparison you can look at the Max and Min actual anomaly maps for March.
BoM anomaly map for Max T you can adjust to see min – this link is for Outlooks on 3rd March – you can reset for late Feb.
Plenty to compare & contrast and ponder.
Perth Airport max T history 1945-2021
An email from Perth pointed out the plentiful mild weather lately. I see that Perth Airport 9021 is used in ACORN so I have had a look-see at all the raw monthly max data from CDO – (December data up to 16th so far).  The first thing that hits me is a step-change coincident with the June 1994 install of a temperature probe (AWS). For larger version chart. Yet the BoM ACORN version for 9021 has no adjustment at 1994. The other point I would make is that UHI would have been steadily affecting this site as Perth housing & suburbia expanded producing warmer breezes. I can look at ACORN data later.
Here is a chart of raw monthly min data from CDO. Less noisy than the max. 
For larger version chart.
Here is a chart of annual mean T plus annual Range (mean T is the metric for “IPCC Global Warming/Climate Change”)  For larger version chart.
Cool summer 2021 for wide brown land
Summer daytime temperatures across Australia were cooler than the average from 1910 even with the graph built from the BoM tweaked ACORN temperature series where the past has been cooled to fit IPCC dogmas. Checking out the summer Outlooks against the real world – the Minimum Temperature Outlook takes the prize for utter failure. How could BoM models predict such an extreme Outlook?
Ask me if you can not find something. With that basic ingredient, the medicine producing companies have produced a lot of medicines they are, in short, Kamagra, Kamagra oral jelly, Zenegra, Silagra, levitra cost of sales , Forzest etc. If you are also one of them and seeking for an economical order prescription viagra remedy. Antimetabolites block the enzyme pathways discount viagra generic needed by cancer cells to death or stop the progression of cancer by preventing them from dividing any further. On one hand, you have stressed-out loved ones urging, pleading, and even screaming warnings about the impending doom; begging you not to go out sildenafil free shipping into the raging storm. Enjoy the way the BoM is promoting warming stories in the face of the cool summer. Ningaloo Nino: The climate phenomenon worrying scientists 1Mar21
BoM changing temperature extremes history
Lance Pidgeon has been working on these 2002 Tables of daily temperature extremes for each Australian State & Territory from the ABS and I decided to show his findings re daily max in this Table. Minimums later.
Readers can check for themselves the BoM sources we used which I have colour coded in my Table.
Red is for what the ABS shows.
Blue shows information from the BoM CDO Climate Data Online.
Pink shows information from the BoM Climate statistics for Australian locations. Change the site number in the URL.
Green shows information from the BoM Daily Extremes Table (select your State and choose Annual which is the bottom Table)
The BoM have since 2011 produced the ACORN adjusted dataset of daily max & min temperatures for their selected sites across Australia and any historic daily max or min from CDO can be altered hotter or colder by ACORN including record extreme hot days. There is now ACORN Version 1 and 2. Generally ACORN adjusts the early part of the 20th Century cooler and more recent data warmer – thus increasing a warming trend in Australian data.
Below are examples of ACORN changes to from the ABS Tables for Oodnadatta and Canberra.
Table showing changes to Oodnadatta; ACORNv1 made no changes but ACORNv2 this year increased the all time Australian hot day record on 2 Jan 1960 from 50.7 to 51.1.
Canberra – ACORNv1 starts at March 1939 so excludes the ACTON record of 42.8 on 11 Jan 1939 but ACORNv2 has rediscovered ACTON and cools the 42.8 to 42.2. 1939 Acton Table. Note further down the Acton table some large cooling changes of -2.3 degrees. Our pioneers sure had bad eyesight.
The old Canberra Airport 70014 saw a hottest day of 42.2 on 1 Feb 1968 which ACORNv1 increased to 42.4 and ACORNv2 snipped that back to 42.3. Fiddle, faddle, stroke & tweak thats the BoM playing with ACORN.
Extreme minimum records by the ABS 2002 see links above. Continue reading BoM changing temperature extremes history