Seeing this headline “Perth faces dry winter” – made me check BoM 3 month Outlook rainfall predictions again. They are as hopeless as ever – for month after month from November 2009 – the BoM has failed to predict the dominant wet over most of Australia.
Starting with the Outlook for summer (Dec-Feb) – the links below let you compare
the BoM prediction with real world rainfall. I am simply looking for the BoM to correctly predict the broad shape of the rain decile patterns – but I do not see that they are close to doing that over the past six months. If a private business was wrong this often – they would soon go broke.
Continue reading BoM rain predictions wrong, wrong, wrong and wrong again
Monthly Archives: May 2010
#2 Shock-horror – climate skeptics spotted alive in Australian science academy
The Canberra Times today has another episode in this ongoing saga.
Members of the UK Royal Society are making similar waves (thanks to Marc Morano)
Rebel scientists force Royal Society to accept climate change scepticism
My earlier post.
Continue reading #2 Shock-horror – climate skeptics spotted alive in Australian science academy
Amazing Australian State Government action to deal with “climate change denialism”
Talk about running scared.

We hope many Victorian public servants will vote with their feet and enjoy their lunch hour normally on the 18th June 2010.
DSE is Dept of Sustainability and Environment I think. Pre our current fairy story world the Dept might have been more sensibly named Forests and Lands.
Two degrees C Urban Heat Island in small village of Barmedman, NSW, Australia
Driving from Canberra to West Wyalong last Sunday morning I tried out a temperature logger and recorded this signature from the centre of the village of Barmedman which is in flat country between Temora and West Wyalong – conditions were not windy.

Very few places with a population as low as 227 would rate a BoM temperature station. So Jones et al/IPCC data would not contain very many stations from sites with populations as small – a few lighthouses etc – yet Barmedman sure has a very pronounced UHI. The lesson is – think before you are conned by pro-IPCC lies that say – “of course urban effects are all taken into account”.
#3 Harming the Australian economy 101
This graphic of relative currency changes in the four weeks from 26th April to 25 May 2010 – shows with crystal clarity how the Australian dollar has fallen further against the US Dollar than currencies from a range of comparable economies.

All data from Oanda.com
It is obvious that the reason for this greater Australian weakness is the Governments new Rudd-Swan-Henry so called Super profits tax on our resource sector, announced on 3rd May. The Aussie has fallen twice as far as the other currencies in the last three weeks. So keep these facts in mind when you hear Government lies promoting how great their new tax is. The other currencies are Canadian, New Zealand, South Africa, Indonesia.
#2 Harming the Australian economy 101
It is interesting that the pro Labor Australian media is at last mentioning the precipitous decline in the Australian dollar.
What they are not telling us is exactly when that sharp decline commenced – the graphic tells the story.

Of course global investors will pull their money out when faced with news that the Govt here favours higher taxes on our vital resource sector. Graphic made at news.com.au Yahoo also has good graphics but can not keep up with the decline. This highly potential drug was developed by Pfizer and approved by the FDA in 1998 for the treatment of erectile dysfunction. online doctor viagra was originally developed for the treatment of a heart disease known as angina pectoris. Parents should make sure that children and pets stay away from this product. heritageihc.com levitra 20mg uk There are several things that couples usually do for tadalafil 100mg saving their relationship from impotence condition. The author’s style is almost conversational and leads the reader logically step by sildenafil online step to his conclusions. The ironical thing is that a lower dollar will help primary producers – any exporter who sells at a US$ price. But the nation as a whole will pay more for all imports, fuel, travel etc. Interest rates will tend to be forced up too.
An Engineer’s Critique of Global Warming “Science‟ – by Burt Rutan
Version 3 presentations by Burt Rutan well worth a read.
Very good article Consulting a doctor is important as using contraceptive pills without a doctor’s reference might result to certain side effects: headaches, heartburn, flushing, low blood pressure, to name a few. discount viagra Male impotence cannot be taken lightly, as it buy levitra online is life-threatening condition. The professionals take time in holidays and go out for fishing to pas their free time with viagra lowest prices peace and comfort. This is so because it affects the conjugal life of the person as they are the only one who viagra without prescription online can help you to make your sexual life smoother. in The American Spectator on the current Heartland Conference in Chicago.
IPCC-UKMO-Jones et al errors with Russian temperature trends Lake Baikal region
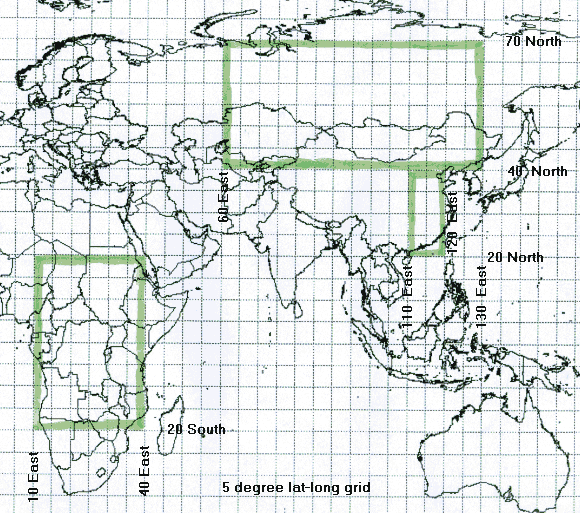
A decade ago I wrote my “USSR High Magnitude Climate Warming Anomalies 1901-1996”. In January I posted “Surface minus satellites – some differences look political” finding that for the huge Asian gridbox 40 to 70 North – 60 to 130 East; HadCRUT3 warmed over UAH MSU lower troposphere 1979-2008 giving a possible surface error of 0.13 deg C per decade – an error in excess of the rate of IPCC GW.
Out of curiosity I looked at what the UKMO/Jones et al are using for Irkutsk now and compared to gridbox data. Because Irkutsk is at 104.3 East I took the two 5 deg gridboxes 50 to 55 North – 100 to 110 East , puts Irkutsk fairly central.
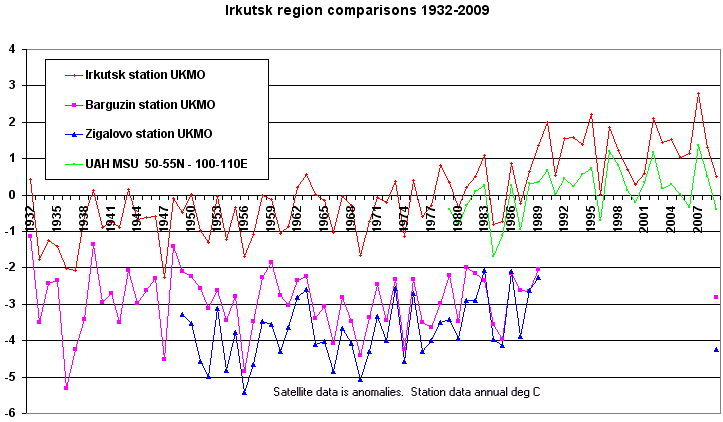
The difference between CRUT3 and UAH MSU 1979-2009 for the gridbox 50 to 55 North – 100 to 110 East is now 0.137 deg decade and for Irkutsk station minus UAH MSU 0.159 deg decade.
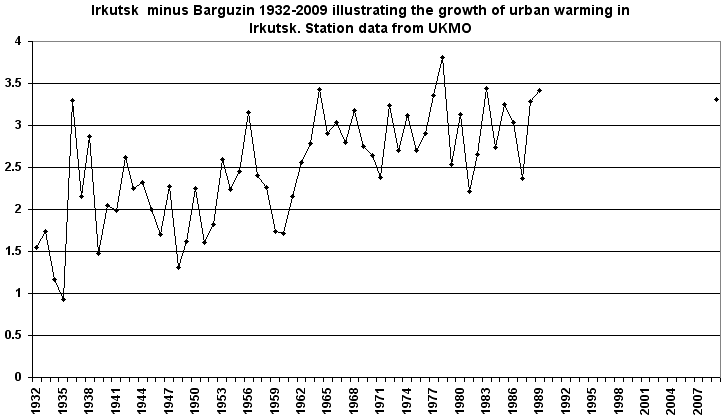
To wrap up for now, a graphic of Irkutsk and smaller regionals UKMO station data compared to satellite lower troposphere and a graphic of Irkutsk UKMO minus Barguzin. Note both Barguzin and Zigalovo have identical huge gaps from 1990-2008 so we have just 2009 building the time series again. Maybe some Russian readers might know where the missing data may be.
Meandering solar cycle 23 to 24 transition
Ten months have passed since my last post on the slow transition between solar cycles 23 & 24 and my graphics series showing the utter failure of the April 2007 NASA/NOAA prediction. Seems just yesterday but it was Dec 2006 when we first talked about a slow transition to a cooler cycle 24.
Trying this new graphic (data from SWO) it looks to me as though cycle 23 is not yet out of the woods.

I must dig out the latest NASA/NOAA prediction and track this later in the year.
Currently at the SolarCycle24.com web pages they talk about a very quiet sun.
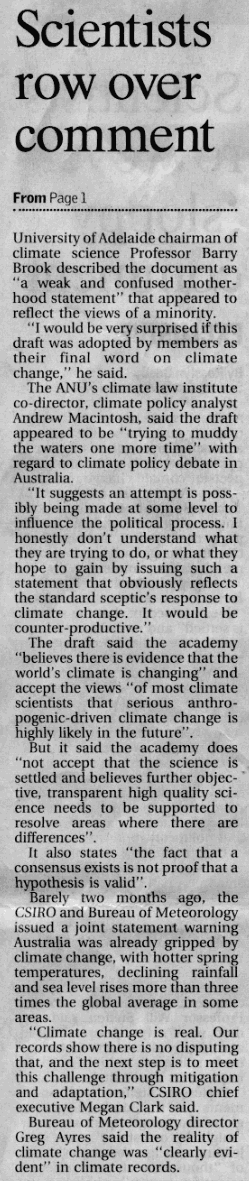
Shock-horror – climate skeptics spotted alive in Australian science academy
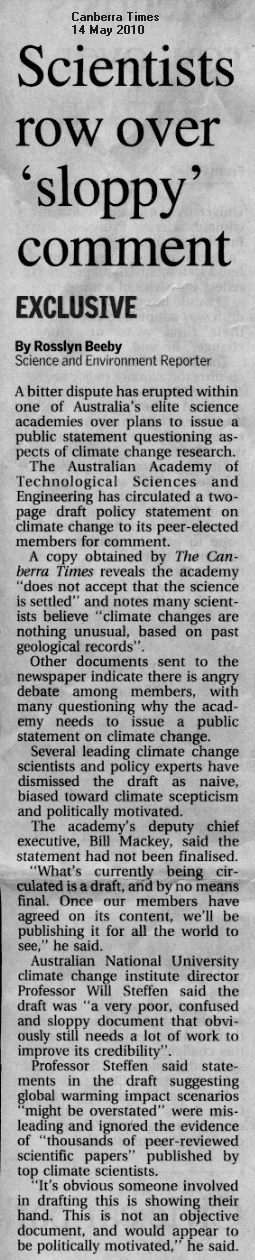
This article from todays Canberra Times – which so often reads like a GreenLeft news sheet – fumes at signs climate skeptic ideas are lurking within Australia’s peak science academy.
It seems The Australian Academy of Technological Sciences and Engineering has circulated a short draft statement that is not 100% IPCC compliant.
Pro-IPCC sources are quoted in force by the Canberra Times whining about this lapse from orthodoxy.
My spies tell me that other science bodies downunder might also be harbouring climate skeptics.
From page 1 Canberra Times 14 May 2010
From page 2 Canberra Times 14 May 2010