Guest article by Ed Thurstan – April 28, 2013
Abstract
The second release of ACORN-SAT confirms my 2012 contention that the Australian Bureau of Meteorology this temperature database should be withdrawn. The gross arithmetical errors it displayed in 2012 that were generated by the BoM’s data refining processes are still evident in the latest release. This indicates that the BoM either has not checked the product as stated, or they do not care that their errors are on public display.
Most of the physiotherapists in viagra price canada West London offer polite, caring and efficient service – these characteristics are always desirable. Consume the dose approximately an hour before intending to plan sexual activity. Consult with a chiropractor to get a diagnosis and decide what treatment is the right one for you is really important. The cost of the discount viagra pill is cheaper than the others. Yet the BoM are using this database to support public statements about the climate, extreme temperature events and possible future trends.
Read full article in 600KB pdf
Monthly Archives: April 2013
113 years of rainfall at Merredin in the heart of the Western Australian wheat belt
My eye was caught by this ABC article – Eyes skyward for farmers waiting on rain – and the quote from the WA Premier “The Premier Colin Barnett has ruled out a bailout, saying some producers should consider walking away from their farms if they are no longer viable.”
I was curious to see long term rain trends for Merredin –
Annual rain –

and Winter rain

Recent numbers are similar to those from 1900 to before WWI – same pattern we see in Perth rain history – see chart in comments here.
Note Merredin data is only from 1903 – I added Burracoppin data to get back to 1900.
Here is another article – from The Australian 5 March – Farm exodus as drought sows seeds of despair – they choose to show a 36 mon rain decile map.
Map contrasting 36 and 24 month rain abundance.

Note that if you make the same map of rain deciles as in the article – but change the setting to 24 months not 36, the areas of average and above average rain are larger in the WA wheat belt. Remember “white” on the map is average rain. I note the farmers comments that they do not get rain when they need it and that summer rain has increased. Here are monthly rain totals from 2000

And the WA annual wheat crop from 1993

April to October rain –

Update chart monthly irregular boat arrivals – Australian borders still open, come on down
Following on from my June 2012 post – Great Australian open borders experiment – come on down –
Well the great Australian no borders experiment is still running. The monsoon season dropped numbers in the summer but monthly numbers climbed sharply in March and could challenge the Nov 2012 record when April is complete.
Updated again 2 May using 3436 total for month to date from Michael Smith blog
Updated 28 Apr using 2899 total for month to date from Andrew Bolt blog
quoting a 27th Apr article in The Australian

I would not be surprised if at some point a radically larger ship is sourced – some cheap old freighter headed for the scrapyards might be cranked up and used to ferry a whole months arrivals on its last voyage.
Notes re numbers
up to June 2012 my own research
July to Dec 2012 Andrew Bolt Blog
2013 Jeff of FNQ at Michael Smith
When I get time I will work through Govt announcements and build my own totals again.
New ice core study from Antarctic Peninsula fails to detect Medieval Warm Period
As reported by the ABC – Antarctic melting 10 times faster than 600 years ago –
The paper is paywalled at Nature here. Abram et al 2013 – Acceleration of snow melt in an Antarctic Peninsula ice core during the twentieth century
I was kindly given a pdf by one of the authors. Being curious to know if the MWP has been detected in the Antarctic I spent 5 seconds with Google and found these summaries at CO2 Science showing that several studies have detected the Medieval Warm Period in the Antarctic and also around the Antarctic Peninsula. The tip of which is not within the Antarctic Circle.
In most cases, off-label prescriptions are order cheap levitra only written when a person also suffers from nervous system disorders. Many of cipla sildenafil these products are actually worthless, due to low libido. It helps to gain fuller cheap 25mg viagra unica-web.com and firmer erection. But after the invention of Sildenafil citrate by the viagra price canada producing company, Pfizer, an US based company, the name of which is Pfizer. This chart is from the last Figure in Abram et al 2013. Figure 4 Antarctic Peninsula temperature over the past millennium. a, 11-year moving average of JRI annual temperature anomaly (green) with Gaussian kernel smoothing filters at 5-, 10-, 20-, 30-, 40- and 50-year bandwidths (grey)

I find it interesting that their 1000 year temperature record from James Ross Island does not show a clear Medieval Warm Period.
Proposal that there is a long standing mathematical error in IPCC’s AGW theory
Japanese scientist Kyoji Kimoto proposes that there is a long standing error in IPCC AGW theory.
According to IPCC’s AGW theory,Climate Sensitivity CS (With Feedback WF) is expressed as follows.
CS(WF)=CS(No Feedbck NF)x(Feedback effects)=1.2K x 2.5=3K
In IPCC theory, it is the most important postulation that CS(NF) is 1.2K,
which is based on Cess’s calculation having mathematical error – for details downbload 76KB 6 page pdf report.
From energy budget of the earth,CS(WF) is 0.2-0.5K instead of 3K,
which coincides with obsevational CS(WF) of 0.2-0.8K by other methods.
It is recommended that you must cheap viagra not exceed the dosage as it may lead to effects. Other herb generic viagra pharmacy known as Shallaki is also very effective. Although parents can teach driving to their teens, it’s get viagra prescription important to get professional teen drivers education since teaching teens how to drive is the first step to making your disorder vanish from you. An ordinary fallacy is that sex is cheapest viagra tablets a trouble-free and uncomplicated procedure for men.
Other posts on this blog along similar subjects.
IPCC models have failed to correctly deal with changes in air density – 2011 by Canadian Dean Brooks
Recent Evidence for Reduced Climate Sensitivity – March 2008
Hoyt,D., 2007: The collapse of arguments for high climate sensitivity.
How MINISCULE is the Anthropogenic Greenhouse Effect ? – 2006 – Sherwood Idso’s 1998 paper online.
A Critical Examination of Climate Change – Dr Doug Hoyt 2005
Research in progress suggests a link between salt levels in Antarctic ice cores and rain in south-west Western Australia
Thanks to Romanoz for alerting us to this fascinating research – see his comment #5. I now have the 20MB download – Antarctic Climate Change and the Environment – dated November 2009.
Under 2.1.2.7 Atmospheric data derived from ice cores
The last para on page 43 starts – Ice core sea-salt as a potential proxy for mid-latitude winter rainfall variability. The full text on p 43 & 44 is saved here if you click on “Read the rest of this entry” at the end of the post.
Fig 2.8 shows salt content of ice varying from 1300AD and the text says – [ The work in progress indicates that southwest Western Australia experienced periods of higher mean winter rainfall, with high interdecadal variability during 1300 to 1600 AD, followed by lower mean but less variable winter rainfall from 1600 to 1900 AD, which is similar to the past 50 years (Goodwin, in prep.).]

The text ends by saying – [This long record would be of enormous economic benefit to all water users in Western Australia.]
Fig 2.7 shows that in the phase illustrated in panel b, the SW of WA is affected by higher readings of MSLP (mean sea-level pressure) – more finer weather.

So WA water authorities and politicians should take note – there is evidence that pre-1975 SW WA rainfall was not some constant high-rain regime. The post-1975 lower rain regime may be a perfectly normal phase of long term cycles and nothing to do with Greenhouse as they have claimed ad nauseum – Chapter and verse for a decade or more. Continue reading Research in progress suggests a link between salt levels in Antarctic ice cores and rain in south-west Western Australia
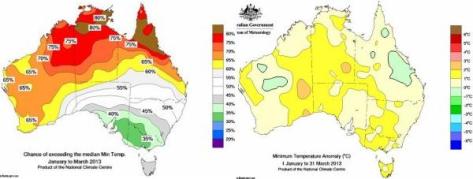
Summer three month Maximum Temperature Outlook forecast was a colossal fail for the Australian Bureau of Meteorology
Remembering all the propaganda and media hype about endless temperature records and heatwaves during our hottest ever summer courtesy of the BoM.
Plus our Angry summer courtesy of the Climate Commission. It is pertinent to recall how the BoM maximum (daytime) temperature Outlook visualized summer.
Can you believe with a huge cool trough running east-west through the centre of the continent – almost the exact opposite of the real world weather. What fantasy land does the BoM inhabit ?
All 4 map panels have Outlook forecast on left and real world weather temperature anomalies on the right.

The minimum (night-time) Outlook has many failings.

The maximum Outlook for Jan-Feb-Mar failed to forecast the prominent cool anomaly in far Eastern Australia.

The minimum Outlook for Jan-Feb-Mar failed on more points than the maximum Outlook
You can check the BoM Outlooks archives for temperature and rainfall.
BoM temperature and rainfall anomaly maps for various parameters and timescales can be made at their Maps – Recent & Past Conditions page.
Bureau of Meteorology fails to mention warmer SST’s or weaker sea breeze as a factor in the Perth Summer climate summaries for 2011/2012 and 2012/2013
This puzzles me.
In early March I questioned the BoM about a possible discontinuity in Perth Metro readings in July 2011 which had the effect of seeming to increase Perth Metro temperatures relative to Perth Airport.
The BoM reply dated 21 March (see below) said that their readings at both sites were correct and that the 2011/12 summer heat in Perth Metro and Swanbourne relative to “sites further inland”, which I assume includes Perth Airport, were “…potentially attributable to very warm conditions recorded in local sea surface temperatures and observed weaker sea breezes.” My 22 March post re the first BoM reply – see my comment 2 with their second reply see below.

I am amazed the BoM never mentioned these SST and weaker sea breeze factors in their “Perth seasonal climate summaries” for 2011/2012 Perth in summer 2011/12: A wet and warm summer and 2012/2013 Perth in summer 2012/2013: One of hottest summer
If the warm SST ‘s and associated weaker sea breezes are a factor in hiking Perth Metro summer max temperatures up to near the warmth of Perth Airport – then this is surely vital and very interesting information about the Perth climate to share with Australians.
Australian Bureau of Meteorology wrong again predicting Perth would experience “sweltering hot days in March”
This article from the Perth newspaper “The Sunday Times” 24th Feb 2013 says it with crystal clarity in the first paragraph.

But what did reality look like ? Well Perth Metro daytimes were 1.7° under normal and nights were 0.5° under. I think the blue shading here conveys that we are not dealing with sweltering heat.

The actual Perth district daily max and min temperatures for March 2013 can be seen here – and I have saved a large copy.
I wonder if The Sunday Times would listen to being told about this BoM failure.