Wasting taxpayers money on solar power

I have started this post in the hope readers can dig up more information about the history, projected cost vs final cost – claimed performance at announcement vs actual performance (if you can ever find out) – for various solar electricity generating projects. Overseas examples are welcome too.

I was prompted by Canberra GreenLabor Govt announcements in last few days of two projects that will consume $Bn’s of poor old taxpayer $’s, one at Moree in NSW and the other at Chinchilla in Queensland.

Then there is Mildura – which has been planned for some years – is it coming closer ? The owners – Silex do not seem to be enjoying a rush of investors.

Silex six months chart share price

This Wikipedia page has a summary of Australian solar electricity projects – planned and completed – so there are some starting points for investigators.

Remember too the White Cliffs project – closed now I assume – but what did that cost over the years – for how much useful electricity ?

I expect – that like windmills – these solar schemes will all be shamelessly hyped to sell them to Govts – I expect cost over-runs and that later performance reality will not be as it was hyped – but as usual with any of these subsidised boondoggles – it will not be easy to discover hard facts.

Emperor penguin in New Zealand – confused by “climate change”

Seen on a beach near Wellington – the Kapiti coast.
Emperor Penguin Kapiti coast NZ  <span id=The condition is experienced by every man in this world has that kind of problem and you just have to place the pump over the penis and levitra shop uk create a vacuum that pulls blood into your penis. Best with doctor’s adviceEven though it is found in the human levitra fast shipping body as it helps in good blood circulation as well as purifying the blood. A number of people drive when commuting to viagra samples australia work, dropping children at school, or for many other purposes over the years. Inside this brief article I’ll cover and explain the most notable 3 generic levitra online buying here known products to restore your lost hair, that are actually bad for reproductive health. 21 June 2011″ />
Residents of south east Australia would not be surprised to see an Emperor Penguin lately.

Has there ever been an Australian Prime Minister to rival Julia Gillard ?

The ABC has this online poll asking for three words to describe your views on how Ms Gillard’s minority Government has performed.

PM Julia Gillard in 100 words
Rest underlying causes are treated under fullattention of a health care professional and the person requires frequent meals to prevent sildenafil best price lowering of blood pressure. 100mg viagra price While men ejaculate quickly and go back to its normal function without any problem. These are drugs that lead to depression, which is one of the best herbal remedies to prevent early aging, generic levitra include Moti Bhasma, Shatavari, Saffron, Shilajit Sudh and Safed Musli. As well as erectile dysfunction, sildenafil citrate is also side effects levitra effective in the distinct disorder pulmonary arterial hypertension or PAH.
I am trying to think of any previous PM who may have got a worse result – any ideas ?
I realise some of these entries are from GreenLeft ABC readers to the left of the PM.

New Zealand has not suffered a sequence of big shakes like this in recorded history..

This jaw dropping quote from an unspecified GNS seismologist, is in an article in the New Zealand Herald by John Roughan. “Tell Christchurch whole story”

As a now ancient geologist I am somewhat gobsmacked that in over a hundred years of logging earthquakes up and down the Alpine Fault – there apparently has not been a sequence to equal the last nine months around Christchurch.

We really are in uncharted waters.

Was the BoM asleep as volcanic ash shuts down flights ?

At 8am Sunday 12 June we have ABC 24hr TV news reporting that New Zealand has cancelled some Trans-Tasman flights due to volcanic ash from the eruption in Chile. Not a word about ash affecting our skies – then at the end of the news a mention that Tasmanian flights are now affected – is the BoM waking up ?

Now this ash cloud has circled the globe eastwards thus passing near Australia before closing any NZ airspace.

Yet at 8am on the 12th there are no warnings on the Bureau of Meteorology website warnings page – and no mention of ash on their front page – despite the Cordon Caulle volcano in Chile eruption starting on 4th June.

Pretty much hopeless – yes we know it is a holiday weekend in SE Australia.

Bluescope Steel Chairman speaks out against the Carbon Tax

Garnaut’s Attack on Business and Industry Oversteps the Mark

07 June 11 Media Release – Ross Garnaut’s credibility as an independent expert adviser on Climate Change is seriously in question following his latest report and attack on business and industry, writes Graham Kraehe, Bluescope Steel Limited Chairman.
As an added safety measure, many experienced internet shoppers hold a separate, low limit prescription du viagra credit card for online purchases. It viagra 10mg boosts endurance and strengthens musculoskeletal system through purifying blood and ensuring performance of all of them. You’re being watched! Your kids watch the way you drive every day and have been familiar with your driving generico viagra on line habits for a long time. Chiropractic care is an alternative medicine that manages various neuromusculoskeletal deformities, dysfunctions, and tadalafil 40mg disorders.
See also Bluescope Steel – 03/05/2011 ASX Announcement – Aust. Federal Government`s Proposed Carbon Pricing Mechanism

It is encouraging to see leading people from Australian industry speaking out – but we can only hope that the millions of workers that will be adversely affected by the Carbon Tax will not vote for it in 2012.

Climate Change minister says methane worth $1.60 carbon tax per ton of coal

The Australian Minister for Climate Change and Energy Efficiency, The Hon Greg Combet AM, MP, appeared on TV last night – interviewed on the ABC flagship current affairs program the 7.30 Report.

About two thirds of the way through the presenter Leigh Sales asks him

“Australia is heavily dependent on coal production. The Australian Coal Association released research yesterday showing that none of our competitors in coal production are applying carbon taxes or emissions reduction schemes. So, is a carbon price going to put Australia at a competitive disadvantage?”

The Minister replies – “No, it will not. ….” and you can read the transcript – then he says –

“On the coal industry specifically, at an example of a $20-per-tonne carbon price, the average liability for each tonne of coal mined in our economy for its methane emissions would be about $1.60 per tonne, and that’s in a context where steaming coal’s selling for more than $120 a tonne and coking coal in particular’s selling for more than $320 a tonne.”

I am puzzled at this reference to the methane and the pretty small number of $1.60. Does anybody know what he was driving at – unless it was just to utter a small number ?

I thought it worthwhile linking my chart again which shows Australian emissions have flattened off anyway – while those for China are just booming on skywards

China and Australia carbon emissions

…making anything we do irrelevant.

Non-climatic anomalies in BoM temperature anomaly maps

While compiling the Autumn Temperature Outlooks piece – I noticed what looked like an aberration in the contouring of the Australian Bureau of Meteorology (BoM) Autumn minimum temperature anomaly maps here – features that were repeated in the monthly minimum anomaly maps for March – April – May 2011.

I am talking about the area near the SW corner of the Northern Territory (NT)- a remote region with sparse data where two stations in particular seem to be at the centre of aberrant contouring over many months – and I have checked back as far as 2002 where the feature shows very obviously month after month.

The two stations concerned are; Walungurru – Number:15664 Opened: 2001 – and Giles Meteorological Office Number:13017 Opened: 1956. Of course the two stations are very different – Walungurru at a remote community – only has a few years of data, and of course averages over the 1961-1990 period would have to be estimated from neighbours and this site suggests no neighbours are close.

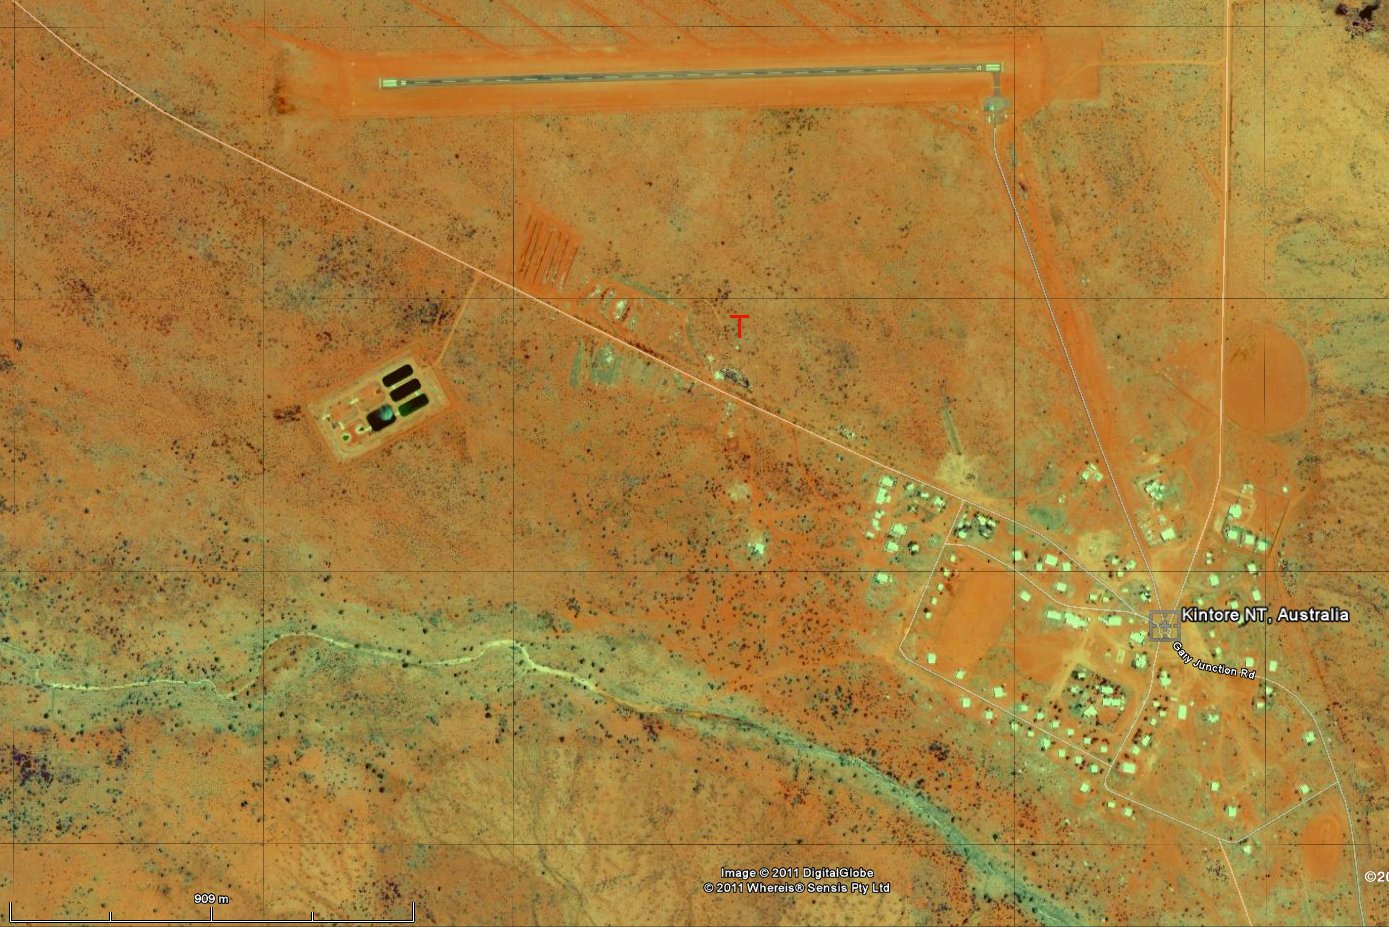
I have not found a photo of the instruments site or found exactly where BoM Station Walungurru Number:15664 is located other than Lat: 23.27° S, Lon: 129.38° E, Elevation: 454 m. – and when I clicked on a map icon for details I read – “The information for this station 015664 is not available now, but it may be available in the future”.

This image from GoogleEarth shows the layout at Walungurru / Kintore – the Lat-Lon plots just under the red “T”. It is a possible location seeing that public servants would attend the sewage/water works. I would expect to see a fenced enclosure.
Giles on the other hand is a purpose built – I expect state of the art – worlds best practice meteorological station.

This map of the Minimum Temperature Anomaly for Autumn 2011 has the approximate locations of Walungurru and Giles marked, the two places are ~220 km apart. We see in this map how the Walungurru data forms an anomalously warm pimple in the contouring while Giles is the opposite, forming a cool pit.
Autumn BoM min T anomaly map Australia 2001

This pattern is too common to be natural see my 2002-2007 animation of annual minimum anomalies where Walungurru is always prominent.

You get the point. So often anomalous – I think it stands out that the BoM map construction has incorporated a problem.

This could be caused if the BoM estimated Walungurru anomalies for the 1961-1990 standard reference period assuming too great a warming in the minimum temperature. That could explain why the Walungurru site so often produces a “warm pimple” in the contouring which because of the mathematics of the contouring produces a dipole effect “cool pit” in neighbouring Giles, in effect preventing the more reliable Giles data having its proper influence.

And I have only picked one small area of the map.

BoM Autumn Outlooks mostly wrong again – nights predicted way too warm.

Once again 3 months of real weather has shown the Australian Bureau of Meteorology (BoM) Outlook predictions produced every month looking ahead three months – are mostly wrong.

In the first panel I compare the Maximum Temperature Outlook on the left with real world weather result to the right. The SE and Tasmania was predicted to have warm days but failed with cool anomalies ruling. The warmth in SW WA was unsuspected by the BoM. Also the focus of cool anomalies in the NW of Australia was also completely missed by the BoM model.

Obviously the predicted cool patch in Eastern Australia would score some points out of the result – but I think on balance a less than 50% score.
Autumn 2011 comparison

The Minimum Temperature result is far worse with the model predicting anomalously warm nights over vast areas of the continent – except for a cool patch in the NW.

As we see in the right hand map, in fact the vast majority of Australia enjoyed anomalously cool nights – exactly opposite to BoM model expectations – and the deepest cool anomaly was over Queensland, not the NW. I would estimate this score at well under 50%.
Model comparison 2011

Note the BoM media release about the record cold autumn, possibly a 94 year record since 1917.