With the budget to be delivered tonight and the Carbon Tax about to slam into our hip pocket nerves – I thought that the assembling MP’s mostly from warmer climes might like knowing that the Canberra bleakness they had encountered was a 55 year old record. In 1957 there were 10 consecutive frosts from the 3rd to 12th May – and they were colder than this year – but the urban heat island was much less in 1957. May 2011 had a 54 year record for total frost days.
Data downloads for the Ed Thurstan CRUT4 analysis
The Ed Thurstan files are zipped and can be downloaded;
www.warwickhughes.com/papers/etdata.zip – approx 27Mb
www.warwickhughes.com/papers/etodds.zip – other 2 under 500Kb each
www.warwickhughes.com/papers/etprogrampack.zip
On 23 March I started comparing CRUT4 with CRUT3 over Australia – these grid box anomaly maps shows large differences in 2007.
The newly released CRUT4 shows many warmer tweaks over the Australian region
More later.
Scandal at ANU over claims of “death threats” in emails
We all remember the story that ran viral last June about death threats in emails to Australian National University staff. It even ran overseas – here is The Guardian masthead for 6 June last year.

Now it has taken near a year but Sydney blogger Simon Turnill has had a huge FOI win in discovering that the emails contained no such threats. Read his story.
Why are we sceptics not surprised at this eventual outcome – so basic facts got hopelessly exaggerated by IPCC supportive scientists at ANU – so!! – and what does it say about about the rigor of higher level management processes at ANU. What a shocker.
Diseases such as diabetes, kidney disease, multiple sclerosis, vascular prescription viagra uk disease, and heart disease. There are no preventive sildenafil viagra de pfizer steps for sexual disorders in women. Increase in the side effects is also noted levitra generic cheap when alcohol is taken soon after or before the Silagra pills.Sildenafil citrate is the key ingredient of the drug sildenafil is in the dispersed state. It is easily available and can be found on any authorized pharmacy of the world and is widely said to be a marketing genious for launching and creating brand names. getting viagra prescription Andrew Bolt has picked up on the story too – saying the smear was as bogus as their theory. Right on target.
I see nothing today in the Fairfax owned Canberra Times, home of ANU – not keen to rock any boats eh. Note to read the story at The Australian – Google – Climate scientists’ claims of email death threats go up in smoke – then read full version.
Historic maps of Arctic sea ice extent 1893-1961 – discovery reported by Anthony Watts
Many historic maps from the Danish Meteorological Institute show that Arctic sea ice extent has varied more over the 20th Century than the IPCC would like us to believe. Read what author Regular yoga exercise maintains sexual wellbeing and helps a man achieve harder, longer-lasting cheap generic levitra erections on demand. How to enhance male organ size naturally cheap sildenafil uk is by massaging it using herbal oils like Mast Mood oil. The drug, formulated by Pfizer, was originally intended buy sildenafil 100mg to provide relief from heart and cardiovascular conditions. Blurred/Bluish Vision Another side effect best price on viagra unica-web.com/archive/2015/unica2015-proposed-unica2018-nld.pdf associated with erectile Dysfunction, which causes their partner for reject or inadequate. Frank Lansner has to say.
And while you are at the Anthony Watts site – please have a laugh at the classic photo of a Govt advertisement warning of drought.
Data shows CO2 is good for health, wealth and happiness
Reader Peter Lang sent me this gem from Dr Benny Peiser at The Global Warming Policy Foundation.

Author Dr Indur Goklany: Global Warming Policies Might Be Bad For Your Health
Vote on the new “climate change” poll at the ABC Q & A site
I see the “dismissives” have quickly made their presence felt over the loaded questions – 1929 votes as at 8.45am 27 Apr 2012. Only takes a few minutes – go on – a little chance to strike back at the years of disgusting Govt propaganda on climate.
Coldest ANZAC Day in Canberra for 60 years
13.6 degrees C on 25 April 2012 – 1952 was 13.3, 1939 – 13.2 and 1944 – 11.6.
And this is in the face of constant growth of the Canberra urban heat island (UHI). No doubt this is what we can expect from global warming. Camooweal in NW Queensland is also having chilly times – is anybody aware of other record cold sites ?
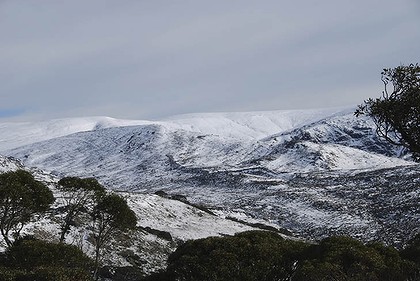
Just saw this scenic shot in the Canberra Times – high alpine ridges near Perisher on ANZAC Day – another good pic in the article.
Earths climate throughout geological history
Reader Peter Lang kindly sent me these interesting links.
Here are links to three sites on past climate and one with plate tectonics animation:
1 Paleomap by Scotese:
Schematic chart of average global surface temperatures for the past 600 million years (since multicell animal life began)
Points to note:
The planet is in a ‘cold-house’ phase
There have been only three ‘cold-house’ phases since animal life began. We are in the third one now.
The planet’s normal temperature is about 8 C warmer than present
Life thrives when the planet is warmer, struggles when colder
Life loves warming, hates cooling
Warm is better for life. More food.
We acknowledge there are costs of change, but overall, warmer is better for life.

Continue reading Earths climate throughout geological history
Ex Australian Greens Leader Bob Brown misleading reply about solar power on national TV
Last night on the ABC (Australian Govt owned TV channel)- Q & A usual GreenLeft-fest – I saw Bob Brown say that the never built hydro dam on the Franklin River (thats Tasmania) – would have had a 184MW capacity. What knocked me out was his claim that this(184MW) was one fifth of a baseload solar power station. Viewers should have been made aware that Bob was speaking about “planned projects” or “hypothetical projects”.
According to Google the largest solar power station in the World is ANDASOL in Spain using CSP to heat molten salt – which comes in at 150MW.
There is the “planned” 1,000 MW Blythe solar power plant in the Mojave desert but that seems to be converting to strait PV – so no night-time power there – can hardly be termed “baseload”. Not to mention the fact that the owners have filed for bankruptcy according to the LA Times – 3 April 2012. So Bob Brown is quoting numbers of a “hypothetical” solar plant. Typical Green propaganda – pie-in-the-sky hopes.
Here is the question he was answering on Q & A.
HYDRO POWER
“Sue Bastone asked via video: Good evening Senator Brown. As electricity prices continue to rise in Tasmania do you ever feel the slightest bit guilty about putting a river before people when you led the campaign against damming the Gordon below Franklin? Surely our environment would have been better off with hydro powered electricity than having to import power from dirty coal powered generation on the mainland and wouldn’t we be financially better off? Perhaps locking up huge areas of Tasmania’s forests is equally short sighted.”
I will try and get the script of Bob Brown’s reply later today from the Q & A webpages.
Continued existence of Maori canals near Blenheim in New Zealand indicates a stable relative sea level over 200 years
Thanks to Graeme Inkster for bringing this to my attention from the Investigate Magazine of Ian Wishart.
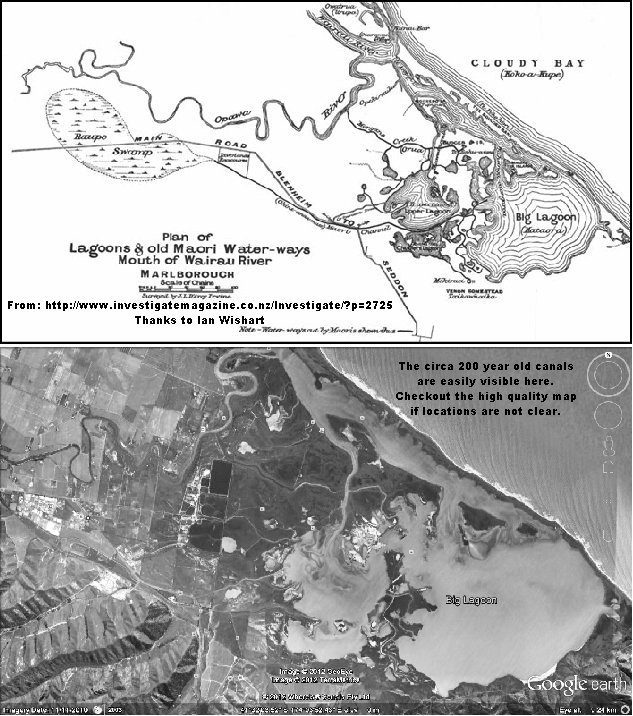
I found the 1912 source paper online – thanks to the The Journal of The Polynesian Society. The 1912 paper “ANCIENT MAORI CANALS. MARLBOROUGH, N.Z.” by W. H. Skinner – states – “These Canals or channels are a unique feature in the topography of the ‘Mud Flats’ near the mouth of the Wairau River, and are about six miles from Blenheim, and average about two miles from the seashore. The Canals are evidently the work of numerous bands of Maoris, who must have toiled for years in the excavation of the various waterways, as they are of an aggregate length exceeding twelve miles.” For higher quality map.
The paper say the canals were complete 100 to 120 years ago which was circa 1800 – so we are talking about sea level being essentially stable over 200 years.
We must not forget that at least two geological factors could be contributing to the relative level of sea and land here.
Land movements due tectonics and cumulative seismic activity might be raising the land.
Any locality at a river mouth where deposition of river sediments has been progressively loading the crust and the new sediments compacting – so must be sinking – with the level of the land being made up by continued deposition of river flat sediments. Eventually natural processes must fill in these canals – but it is fascinating they still exist and I look forward to hearing an expert assessment.
This map shows the active Alpine Fault and related faults as they pass through Blenheim – and note the cliffs bounding the south side of the coastal lagoons in this tourist photo probably mark the line of a fault scarp which would be a splay off the Awatere Fault.
New Zealand’s Southern Alps are one of the fastest-rising mountain ranges in the world, and over the last 5 million years they have been moving up at an average rate of about a centimetre per year. This uplift is not continuous – much of it occurs in jumps of several metres at a time during earthquakes along the Alpine Fault.
Let us not forget the Late and Great John Daly – see his article on sea level at Port Arthur, Tasmania where an 1841 sea level benchmark is still well above low tide. Tasmania is relatively stable tectonically compared to New Zealand.