Ongoing review of 1986 Jones et al papers compiling global temperature trends that now define "IPCC global warming"By Warwick Hughes and other hard working contributors  who can choose to remain anonymous.

This page originally posted in late 2005  is  being updated post ClimateGate in late 2009  and the essential task of highlighting errors in the various Jones et al iterations of global temperature trends will continue.  The  1986 Jones et al station data  can be graphed online and  nearest neighbours examined.
For over 200 years Earth has been recovering from the Little Ice Age (LIA) and the associated solar minimums so of course  warming has taken place.  Our position in continuing to draw attention to the appalling deficiencies in the Jones et al methodologies can be expressed  simply by in effect saying  the following to the IPCC and their cohorts.  You are proposing huge changes to the World economic system, surely the onus is on you to measure global temperature trends using data that does not include many hundreds of temperature records contaminated by local urban heat islands.   That is what this review is about, a stepping stone to generating global temperature trends from land station data much less contaminated by urbanization than the Jones et al IPCC trends.  A great and pervasive mythology has grown up over two decades that the Jones et al papers somehow "adjusted for urbanization".   If anyone can demonstrate this we are open to being told.  Download various versions of Jones/CRU station data and most important Jones papers as pdf.
Certainly Jones et al TR022 and TR027 documentation books specify  many "corrections" for the multitude of, steps, jumps and inhomogeneities that bedevil temperature data due to site moves and various station changes.  To confuse this with their data being  "adjusted for urbanization" is indeed a gross misapprehension. Page listing all Southern Hemisphere stations.  Readers can judge for themselves the veracity of the Jones et al statement on p1216 of Jones et al 1986b, where they state that "... very few stations in our final data set come from large cities."  This glib and lulling  statement is detached from the reality that 40% of their ~300 SH stations are cities with population over 50K.

First the two 1986 papers by Jones et al; links to free  pdf 's of the papers.
Northern Hemisphere Surface Air Temperature Variations: 1851-1984
P.D. Jones, S.C.B. Raper, P.M. Kelly, and T.M.L. Wigley, R.S. Bradley and H.F. Diaz;
Journal of Applied Meteorology: Vol. 25, No. 2, pp. 161-179.

and
Southern Hemisphere Surface Air Temperature Variations: 1851–1984
P.D. Jones, S.C.B. Raper, and T.M.L. Wigley;
Journal of Applied Meteorology: Vol. 25, No. 9, pp. 1213–1230.
Remember,  the journal papers are about what Jones et al want readers to see.   The TR022 and TR027 books below tell you what they DID.

Supporting documentation (~350 page book) published by Office of Energy  Research , Carbon Dioxide Research  Division, US Department of Energy; For the first time on the www 23 scanned pages of  "Station History and Homogeneity Assessment Details" from the Scandinavian and USSR pages of the lengthy Appendix A have been posted. Intereted readers should ask for copies of TR022 and TR027 from  cdiac@ornl.gov   The two key Tables from  TR022   (NH)  are online; as is the     Familiarity with the TR022 and 27 books  is important to reviewing the Jones  data in an  informed way.
Jones PD , Raper SCB, Cherry BSG, Goodess CM,  Wigley TML, Santer B, Kelly PM,  Bradley RS, Diaz HF,  (1985)  TR022  A Grid Point Surface Air Temperature Data Set for the Northern Hemisphere. Office of Energy  Research , Carbon Dioxide Research  Division, US Department of Energy. Under Contract No. DE-ACO2-79EV10098
and

Jones PD , Raper SCB, Cherry BSG, Goodess CM,  Wigley TML,  (1986c)  TR027  A Grid Point Surface Air Temperature Data Set for the Southern Hemisphere. Office of Energy  Research , Carbon Dioxide Research  Division, US Department of Energy. Under Contract No. DE-ACO2-79EV10098

Full TR027 Southern Hemisphere Book html version
(Note 20th Feb 2010)  A  volunteer has  scanned to pdf the 1991 Martin Marietta Edition book  combining TR022 - TR027 plus other material. These wil be posted as they are built over next few days. The first pdf  (2.5MB) is the article,
AN  UPDATED GLOBAL, GRID POINT SURFACE AIR TEMPERATURE ANOMALY DATA SET: 1851-1990 
contains much detail of Fortran and SAS codes. The next four pdf's  comprise  TR022.
TR022A.pdf - 27 page 9.8MB pdf,  text and figures runs to page 26, page 27 is start of Appendix A with descriptions of data layout and quality codes for all stations examined.  These quality codes relate back to Table 1 on page 16.
TR022APPA1.pdf - 114 pages 6.7MB pdf, Appendix A stations descriptions split at page 114 when Barrow Alaska starts the voluminous USA section.  The order of nations data is best seen in the shorter Appendix B final pdf. Note the original printing of Appendix A was not thr greatest for clarity.
TR022APPA2.pdf - 80 page 5.6MB pdf with the remainder of Appendix A starting with North America.
TR022APPB.pdf - 35 page 3MB pdf, with Appendix B (stations USED in gridding) The first page describes the column headers and relates back to Table 2 at page 18 in the TR022A.pdf

Despite the fact that these were long and complex papers in their own right, backed up by ~350 pages of  station documentation for over 4,000 stations and at least a reel of magnetic tape, these papers sailed serenely through the review process each in about three months, without a single "Comment" being published in the Journal of Climate and Applied Meteorology, a publication of the august American Meteorological Society (AMS).
Abstracts for all issues can be read online.
The N Hem. paper in in the February  issue and S Hem. in September. Spend a few minutes checking other papers and you will see that many papers reporting results from vastly simpler and less voluminous research projects  than Jones et al were delayed in review often up to a year.

Past Reviews

The only published review the writers are aware of  was published in 1988 by Fred B Wood in the Elsevier journal, "Climatic Change".  Note; Dr Fred B Wood was from the Office of Technology Assessment, United States Congress.
Wood, F.B. 1988, "Comment:  On the need for Validation of the Jones et al. Temperature Trends with respect to Urban Warming", Climatic Change 12,  297-312.

Dr's Jones and Wigley replied in the same issue;
Wigley, T.M.L. and  Jones, P.D. 1988; "Do large-area-average temperature series have an urban warming bias ?", Climatic Change 12, 314-318.

(In the weeks and months ahead we will work through the points Wood raised,  match them with Wigley & Jones replies and comment ourselves .WSH 26Sep05)  One can only wonder why Wood's critique of Jones et al was not published by A.M.S., where it belonged.

In Australia, two unpublished reports were generated  about 15 years ago which  went to the issue of the validity of using urban stations to compile large area temperature trends.

[1]  The 1990  BoM draft Paper,  M.J. Coughlan, R. Tapp and W.R. Kininmonth;   1990, "Trends in Australian Temperature Records" by three senior BoM staff, defined urban heat island (UHI) magnitudes by various comparisons between central city sites in all the Australian state capitals and their respective airports, more than one satellite site in the case of the larger cities. 
The BoM found substantial urban warming greater than the scale of global warming.  Extracts from  Coughlan et all 1990 are in italics below.      View first page of  Coughlan et all 1990;
Download  300KB zip file of 18 gif images  of  Coughlan et al 

Conclusion From Coughlan, et al 1990  re Urbanization Trends

3.3 Mean temperatures

Estimates of the trends in the annual average daily mean temperature also indicated warming at most of the non-urban sites except Brisbane Airport. The strongest warming over the periods examined was 0.26 C decade-1 Mean temperatures at Brisbane Airport cooled by approximately 0.03 C decade-1.    Trends in urban-rural differences were all positive.

These estimates are greater than those of the trends this century, reported by Jones et al. (1989), in annual mean Southern Hemisphere air temperature, over both land and sea, and sea surface temperature, which have all shown rises of approximately  0.06 C decade-1. 

The authors or BoM, whoever, failed to comment  to the relevant Journal that the 1986/1989  Jones / CRU papers generating the IPCC "global warming", did in fact use these UHI contaminated Australian state capitals, a methodology that by any scientific logic has to be highly questionable in view of the findings by the  BoM.  Not to mention hundreds of published papers over the decades defining the UHI in various localities.

Comments to Journals are a frequent event when scientific differences need resolving or areas of disagreement  need clarifying.   A body with the prestige of the BoM should have had no problem getting its voice heard in the A.M.S. Journal if the will was there.   The prevailing view in the BoM was obviously that it was more important not to "rock the new IPCC boat",  than to draw attention to blatantly bad science.   Considering Australia's great interest in the development of IPCC policy as a large resource exporter,  policymakers today should be asking the BoM for a  public "please explain"  over their 1990 meek acceptance of the bad science involved in the use of  Australian temperature records containing UHI exaggerated warming trends,  by the UK CRU / Jones research group and the IPCC.

[2]  The Australian Record on "Global Warming" - Tasman Institute 1991 review of the Australian component of temperature records used in the 1986 Jones et al Southern Hemisphere paper, (ref at top of page.)
In 1991 the writer (WSH)  reviewed the Jones et al temperature data for Australia along with a wider selection of Australian data while associated with the Tasman Institute in Melbourne.  The Executive Summary of that unpublished report which was circulated to interested parties, has survived in digital form and is presented here for the first time. Note, the Tasman Institute was a free market think tank  in Melbourne for about a decade, closing in the late 1990's.

Executive Summary
The major work by P.D. Jones and his team at the Climate Research Unit, University of East Anglia (Jones, et al 1986a) contains the most up-to-date compilation of the land temperature trend for the southern hemisphere.  In examining in detail the long term trend in temperature records for Australia, this paper provides a critique of the data used by the East Anglia study.

Our conclusion is that Australian temperatures have exhibited no upward trend over the past century.  This conclusion is in contrast to the continental warming trend implicit in the East Anglia study from the stations chosen.  The main reasons why our conclusions differ are that the East Anglia study:

•    included a number of heat island affected city records;

•    excluded other long term records from rural Australia. 

The East Anglia study drew heavily upon data from major urban centres.  One reason for this is the likelihood that such centres' temperature records have been kept more professionally;  in addition, it is easier to trace the need for adjustments due to station shifts in major centres.  Clearly, there are deficiencies in temperature measurements in earlier years and it may well be that the records from more remote stations are inferior to those of the city sites.  However, an examination of peaks and troughs for city and remote sites show a consistent pattern after adjustment for the trend.  This indicates that one possible source of error - human error - is unlikely to be systematically present.

A comparison of trends in the Australian stations used in the East Anglia study with those of stations situated in the same geographic region shows the warming reported by the study to be due to local heat islands rather than a continental warming trend.  Heat islands are widely recognised as occurring in urban areas because of human settlement and infrastructure causing the retention and emission of heat on a local level.  Although the East Anglia study claims to have taken this factor into account in deriving its trends, we consider it to have done so inadequately.  Our own findings, that the dominant reported trends in Australia are due to local heat islands, are consistent with those others have produced, especially in the U.S. 

The following graphs compare the average temperature trend for the 25 regional and remote Australian stations, for which data was available over the years since 1882, with the average temperatures for the six Australian capital cities.  The East Anglia study used five Australian capital cities out of its 13 long term stations. 

GRAPH 1
average temperature trend for the 25 regional and remote Australian stations
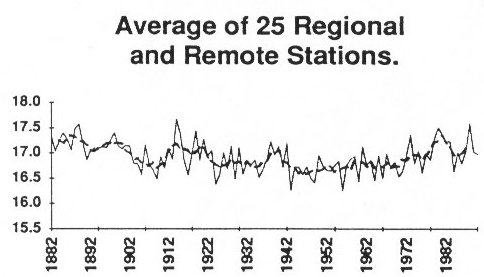
Geraldton, Narrabri, Hay, Albany, Rottnest Island Lighthouse, Walgett, Deniliquin, Bourke, Cape Naturaliste Lighthouse,    Coonabarabran, Echuca,  Cooma, Darwin, Moruya Heads Pilot Station, Omeo, Dubbo, Alice Springs, Gabo Island Lighthouse, Bathurst, Strathalbyn, Mt. Gambier, Yamba,  Wilsons Promontory Lighthouse,   Newcastle Signal  Station,  Cape Otway Lighthouse.


GRAPH 2
Temperature trend 1882-1990 Australian cap cities
Sydney, Melbourne, Brisbane, Perth, Adelaide, Hobart
The East Anglia study contains other data with the potential to cause bias, notably truncation of data in many stations, so that they covered only the most recent 30 years.  During those 30 years, some warming undoubtedly occurred following a general cooling period up to the 1940's, a phenomenon which can be observed in Graph 1 above. 

This study does not attempt to produce a temperature trend for Australia as a whole, although the trend of the remote stations where long term data is available provides a guide.  Perhaps of greater significance, our detailed examination of the Australian data reflects adversely on the entire data set used by the East Anglia study, a data set that has been highly influential in providing apparent corroboration of global warming.  
On 24 Nov 2009  I posted a blog article  "Jones et al 1986 methodical insertion of warming bias" which is seven  pages from  The Australian Record on "Global Warming" dealing with Short Term Records. 
Jones et al  trends in South Africa are even more dominated by cities than their Australian data.
In 1991 I started hunting down temperature data that was not used by Jones et al 1986 and this lead to me contacting the South African 'Weeburo"  late in 1991 by  mail.  Despite considerable turmoil in that country I had the luck to encounter a helpful  official  who mailed me back a couple of diskettes with rural and small town data from 1960-1990.
This lead to the 1996 paper with Professor Robert  C. Balling Jr., of Arizona State University which was posted online years ago by the late John Daly.
1996           Warwick S. Hughes and Robert C. Balling, Jr. "Urban Influences on South African Temperature Trends." International Journal of Climatology, Vol. 16, No. 8, pp. 935-940. Online at http://www.john-daly.com/s-africa.htm
The paper demonstrates large differences between rural trends and the Jones et al trends dominated by cities.
Of course hugely ignored in IPCC circles.  After 1991 I tried to obtain longer term S.A. data but co-operation stopped after they were contacted by  BoM people.  We know how it works.

Starting in 2000 I began my web pages "Global Warming".
Reviews of Jones et al station data have been posted on a city by city basis.
There are also reviews of complete station data for various 5 degree grid cells, in parts of the USA, Canada and the old USSR.
My  most extensive review is "USSR High Magnitude Climate Warming Anomalies 1901-1996"
, the very core of IPCC global warming.
Posted 26 Sep 2005  The site will be expanded over at least the next  year
Contributions, ideas, feedback and comments welcome, confidentiality is assured if required.
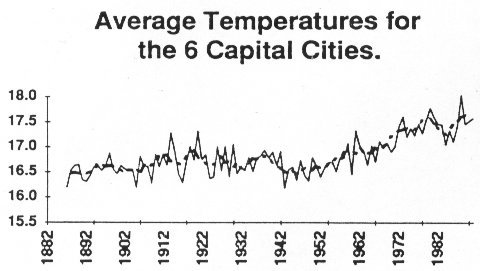