The Jones et al 1990 Letter to
Nature: a rebuttal of some key points
Jones PD, Groisman PYa, Coughlan M,
Plummer N, Wangl WC, Karl TR (1990) Assessment of urbanization effects
in time series of surface air temperatures over land. Nature
347:169-172 [Click links in table for scanned
pages]
What does the letter say and
why is it still important?
This 1990 Letter presents three regional temperature time series (all
termed “rural”) built from weather station records that in general
excluded large cities. It compares the results of these three
series with the Jones et al 1986 gridded series. An observed
similarity in the trends of the two sets is then taken as evidence that
the gridded series contained negligible urban heat island (UHI)
influence.
The Letter was still quoted by the IPCC in its 2001 Third Assessment
Report (TAR) as one of the two pillars of the claim by Jones, his
supporters and the IPCC itself that any remaining UHI contamination in
long-term temperature series is mimimal:
“These results confirm the
conclusions of Jones et al. (1990) and Easterling et al. (1997) that
urban effects on 20th century globally and hemispherically averaged
land air temperature time-series do not exceed about 0.05°C over
the period 1900 to 1990 (assumed here to represent one standard error
in the assessed non-urban trends).”
http://www.grida.no/climate/ipcc_tar/wg1/052.htm#222
The other pillar of the IPCC position, the Easterling et al. paper from
1997, has serious flaws, see here: http://www.warwickhughes.com/climate/easterling.htm.
So unless the Jones letter is sound, the IPCC’s contention that urban
warming does not exceed 0.05 degrees over the 20th century is
unsubstantiated.
The Letter in context
It is fair to see the Jones et al. Letter as part of an attempt to
deflect ongoing criticism that trends in Jones’ 1986 gridded data had a
significant UHI component unrelated to greenhouse warming. So it
is likely there were mutterings of dissatisfaction in climate circles
and by people who took the trouble to follow the debate in Wood
1988. One example of this is the Australian Bureau of Meteorology
(BoM) paper: Coughlan, Tapp and Kininmonth,
1990, "Trends in Australian
Temperature Records" (which I have online at
http://www.warwickhughes.com/climate/bom.htm) which estimated the
magnitude of UHI contamination in Australian city data as follows:
"Estimates of the trends in the
annual average daily mean temperature
also indicated warming at most of the non-urban sites except Brisbane
Airport. The strongest warming over the periods examined was 0.26 C
decade~1 Mean temperatures at Brisbane Airport cooled by approximately
0.03 C decade 1. Trends in urban-rural differences were all positive.
These estimates are greater than
those of the trends this century,
reported by Jones et al. (1989), in annual mean Southern Hemisphere air
temperature, over both land and sea, and sea surface temperature, which
have all shown rises of approximately 0.06 C decade 1."
This paper and others circulating at
the time (see note on Eastern Australia below) show that Jones et al
had grossly underestimated UHI influence in their gridded series by
failing to seek out true rural trends, and failing to understand that
their so-called rural series were in fact seriously contaminated
by the UHI effect.
Jones et al.’s Letter to Nature attempted to contradict this by
reference to supposedly rural series in three regions of the globe:
Western Soviet Union, Eastern Australia and Eastern China. The
authors also referred to rural vs. urban trends in the 48 contiguous
States of the USA.
Western USSR
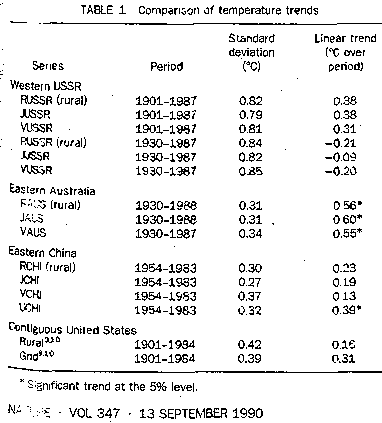
Out of 38 stations in the Jones et al. rural series for this region, 9
were from towns circa 10,000 population, all 80+ kms from major cities,
and the remaining 29 were from more remote sites. We are
currently trying to identify these 38 stations in order to verify the
Jones et al claims. However, note that regardless of whether the
stations were truly rural, the results of this part of Jones et al’s
analysis hardly support the “party line” of a maximum of 0.05 degrees
UHI contamination over the whole twentieth century. In fact, they
find UHI contamination of at least 0.12 degrees in 57 years (1930-87) –
equal to around 0.2 degrees per century, or four times the claimed
maximum.
New page working through process of trying to identify all
of the 38 rural stations.
Eastern Australia
The Letter also quotes an Eastern Australian series of 49
stations generated by Plummer of the Bureau of Meteorology (BoM) and
others, for which the population averaged circa 5,775. From 1991
onwards I had frequently warned the BoM and its staff that this series
carried significant UHI contamination, and I circulated papers to them
demonstrating this, e.g. "Heat Islands in SE Australian Country
Towns". But they steadfastly refused to see reality.
In the years to 1994 I worked on a big paper assembling the most rural
series possible for Eastern Australia, bearing in mind the data
shortcomings in records further from population centres.
 This paper, "Eastern
Australia temperature variations 1930-1992" was co-authored with Dr
Robert Balling Jr in 1994, submitted for publication in J Climate, and
killed in review by someone in the BoM with IPCC connections.
"Eastern Australia temperature variations 1930-1992" is scanned online and in my
view it represents the most comprehensive attempt up to the mid-1990's
to define truly rural trends over a significant area. The table
on page 16 shows that the Jones et al 1986 . gridded series for
the
same region warms at 0.102 degrees per decade, just above Plummer and
about double the true value if urban influences are rigorously excluded.
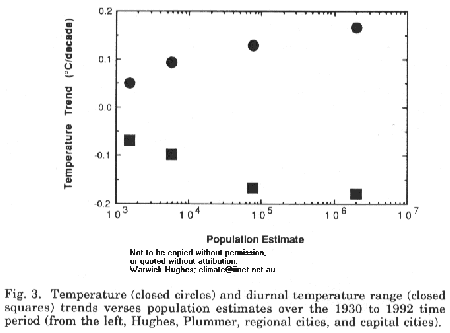
The figure on page 19 shows exactly how mean temperature (T) and daily
temperature range (DTR) will typically vary for a regional array of
station data classified by population. The shape of these
relationships was confirmed in a 2000 paper: Anthony Brazel, Nancy
Selover, Russell Vose, Gordon Heisler: Clim Research Vol. 15: 123 135,
"The tale of two climates Baltimore and Phoenix urban LTER sites" (see
their Figs 6 and 7 comparing T and population).
A similar gradation of UHI trends with increasing city population was
depicted in Warwick S. Hughes and Robert C. Balling, Jr. "Urban
Influences on South African Temperature Trends." International Journal
of Climatology, Vol. 16, No. 8, pp. 935-940. See figure 3 here: South African paper
; Note also the large trend difference in our
Figure 2 between our non-urban data (orange trendline) and the Jones
1994 gridded series.
The bottom line is that Jones’ Eastern Australia data contains
UHI effects amounting to ~0.05 degrees per decade –
i.e. 0.5 degrees per century, or nearly ten times the rate claimed by
the IPCC.
Eastern
China
For this large region Jones et al 1990 examines 42 station pairs of
rural and urban sites but the "rural" stations had populations "…mostly
less than 0.1 million…".
New page outlining steps to discover the 84 stations in Jones et al 42 urban / rural
pairs.
We are trying to identify these 84
stations in order to verify the Jones et al. claims, but it is obvious
that a station with a population of anywhere near 100,000 can hardly
provide a “rural” benchmark. An indication of the massive UHI influence
in CRUT2 Sino grid cell data for the years
1979-2005 is given by comparison with MSU trends.

USA
The Letter also looks at UHI influences in the “lower 48” states of the
USA. Once again, Jones’ results contradict the de minimis
estimate of 0.05 degrees per century UHI contamination, since his own
estimate for this region is 0.18 degrees per century.
Conclusion
It is remarkable that this paper is still listed in the IPCC 2001 TAR
as backing the claim that UHI influence in Jones et al. gridded series
is only ~0.05 degrees per century. Considering the inadequacy of
the only other reference the IPCC provides (Easterling 1997), its
judgement on the scale of UHI contamination in long-term temperature
aggregates is without serious foundation.
Back to Review comments
on climate
papers
by key "IPCC Supportive" scientists main page
There have been many posts at ClimateAudit on the subject of the Jones et al 1990 Letter to Nature in
the first half of 2007 and most of these are linked or copied
below, if there is no link then the date will get you in, most
recent on top. Many of these posts touch on areas where work is
still in progress.
April 29th, 2007
Queensland in Jones et al 1990
By Steve McIntyre
http://www.climateaudit.org/?p=1502
April 28th, 2007
Some Australian Station Plots
By Steve McIntyre
http://www.climateaudit.org/?p=1492#comments
April 27th, 2007
Low Head and the Gnomes of Norwich
By Steve McIntyre
April 27th, 2007
The Maatsuyker Exclusion
By Steve McIntyre
April 25th, 2007
Phil Jones and Australian Billabongs
By Steve McIntyre
http://www.climateaudit.org/?p=1485
April 17th, 2007
CRU on Rural Data Exclusion
By Steve McIntyre
April 16th, 2007
Gridcell 47.5N 97.5E: Mongolia
By Steve McIntyre
Monday, April 16th, 2007 at 1:43 pm
Gridcell 42N, 112E Huhehaote
By Steve McIntyre
http://www.climateaudit.org/?p=1440
April 16th, 2007
CRU and Gridcell 27.5N 117.5E
By Steve McIntyre
Sunday, April 15th, 2007 at 8:56 pm
HadCRU3, GHCN and China
By Steve McIntyre
http://www.climateaudit.org/?p=1426
April 14th, 2007
Dulan Satellite Photo
By Steve McIntyre
April 14th, 2007
Jones et al 1990, TR055 and GHCN
By Steve McIntyre
http://www.climateaudit.org/?p=1405
Wednesday, April 11th, 2007 at 12:02 pm
Some China Comparisons
By Steve McIntyre
http://www.climateaudit.org/?p=1387
April 9th, 2007
Dulan Junipers and the Silk Road
By Steve McIntyre
April 3rd, 2007
Freedom of Information - Jones et al 1990
By Steve McIntyre
March 28th, 2007
IPCC and Data Access
By Steve McIntyre
Tuesday, March 13th, 2007 at 1:06 pm
Jones and the Great Leap Forward #2
By Steve McIntyre
http://www.climateaudit.org/?p=1241
March 12th, 2007
East Anglia Refusal Letter
By Steve McIntyre
March 9th, 2007
FOI Request to Phil Jones
By Steve McIntyre
Tuesday, March 6th, 2007 at 10:29 am
Barabinsk, Russia 57N, 77E
By Steve McIntyre
http://www.climateaudit.org/?p=1219
Friday, March 2nd, 2007 at 10:17 am
Reading meteo.ru Data
By Steve McIntyre
http://www.climateaudit.org/?p=1216
Friday, March 2nd, 2007 at 9:11 am
Gridcell 62N, 77E: Tarko-Sale, Russia
By Steve McIntyre
http://www.climateaudit.org/?p=1214
March 1st, 2007
Malye Karmakuly, Russia (#2)
By Steve McIntyre
http://www.climateaudit.org/?p=1208
Wednesday, February 28th, 2007 at 12:33 pm
Phil Jones and the Kazakh Copper Smelter (47N 67E)
By Steve McIntyre
http://www.climateaudit.org/?p=1203
Monday, February 26th, 2007 at 3:51 pm
Phil Jones and the Great Leap Forward
By Steve McIntyre
http://www.climateaudit.org/?p=1193
Sunday, February 25th, 2007 at 2:34 pm
Phil Jones and the Dutiful Comrades
By Steve McIntyre
http://www.climateaudit.org/?p=1187
February 17th, 2007
HadCRU3 versus GISS
By Steve McIntyre
http://www.climateaudit.org/?p=1150
 This paper, "Eastern
Australia temperature variations 1930-1992" was co-authored with Dr
Robert Balling Jr in 1994, submitted for publication in J Climate, and
killed in review by someone in the BoM with IPCC connections.