What is it about something as simple as rainfall that gets our leaders and politicians talking nonsense ?
Remember in 2007 (during May that had average rainfall) the then WA Premier Alan Carpenter said – “It has stopped raining in the south west of Western Australia……”.
And it is not just WA Premiers, NSW too has the virus.
Anyway – it has happened again.
The Perth Arena which is under construction is afflicted by mould – which is causing those involved some angst and the WA Premier Colin Barnett opines that it is due to a wet winter. How does the media not call him out over such nonsense. A quick check of BoM data shows Perth has had a winter (Jun-Jul-Aug) with 448mm rain compared to a long term average of 479mm.
So it has NOT been a wet winter.
I wonder if the Premier has been brainwashed by a decade of WA Govt Water bureaucracies propaganda about “Our drying climate”.
Does he believe now that Perth normal winters now are dry ?
Dry enough to build the arena without safeguarding against rain ?
I do not know.
But surely it is obvious to anybody with the brains to check Perth’s rain history, that the winter months are very likely to see a fair bit of rain.
What will this cost WA taxpayers ?
Category Archives: Water
Queensland Flood Commission says to lower Wivenhoe Dam levels to 75% on basis September forecasts
This of course assumes that a reliable forecast exists – on which to base this proposed very serious action. The only forecasts I am aware of are the BoM Rainfall Outlooks which are published usually after the middle of the month and cover the next 3 calendar months.
I have just checked the BoM September Rainfall Outlooks for the 11 years of their archive, for the Brisbane catchment area. I make the score 5 wins, 5 failures and 1 too close to call.
If valuable dam water is to be released from say October onwards – on the basis of useless BoM 3 month forecasts – then it is inevitable there will be a considerable risk that this will be in vain.
But it would help to keep upward pressure on the price of water.
From mid 2010 I have several articles critical of BoM Outlooks:
BoM incompetence again – for the 5th month in a row
Ongoing BoM utter incompetence
#2 Ongoing BoM utter incompetence
#3 Ongoing BoM utter incompetence – month after month
#4 Temperature too – not just rain – ongoing BoM utter incompetence – month after month after month
#5 BoM Spring Outlooks – rain and temperature – more hopelessly wrong models
Wentworth Group scientists quit ‘flawed’ Murray-Darling process
Good riddance say I.
A group of leading scientists contributing to the development of the Murray-Darling Basin Authority’s (MDBA) plan has pulled out of the process, calling the plan to fix the ailing river system seriously flawed.
The Wentworth Group of Concerned Scientists says it can not be part of a plan which it says will fail to fix the river system but waste billions of taxpayer dollars.
The group says no less than 4,000 gigalitres must be returned to the Murray-Darling river system in order to fix it, but says it appears that will not happen under the draft plan so it has resigned from the process.
Read on below
Continue reading Wentworth Group scientists quit ‘flawed’ Murray-Darling process
BoM 3-month outlooks hopeless again
The BoM 3 month forecast Outlooks improved for three months after Spring 2010 but have deteriorated again over the last two months.
Below I have six panels showing Outlook forecast map alongside realworld results map for rain and max & min temperatures.
Outlook period January to March 2011
Rainfall

The Outlook has a western and eastern rain peak with a dry trough in between. In real life there was no sign of that – in fact the eastern area included some dry areas and there was no sign of the predicted large dry patch near Haddon Corner. IMHO this result would score under 50%.
Maximum Temperature

The huge hot patch predicted over the SE failed to happen.
The large predicted cool patch over WA was at best a 50% success. Overall I doubt it could score 50%.
Minimum Temperature

For more information, please visit 99eyao website: Or see related articles like Be Careful! These Symptoms May Indicate Prostatitis: Infertility is far more common than most people think. Usually, erection is not as firm as required, but also not long lasting leading to the formation of stones in click here generic viagra cheapest them. Most prevalent warning signs are mentioned here which makes the pill different and better than tadalafil mastercard . You can choose a small packet if you do not have your prostatitis cured cheap generic viagra timely, please prepare to face these symptoms and bear the prostatitis. First the prediction was for warm and hot nights over all of the continent – this did not happen as the real world was far cooler (as usual) than the BoM expected. The Outlook completely missed the large cool anomalies in the north half. I doubt it could score 50%.
Outlook period February to April 2011
Rainfall

The huge dry prediction over the SE never happened except for the small area in NE NSW. The SW WA dry patch was not predicted. It might score a 50%.
Maximum Temperature

It is clear enough no great success. Where they predicted notably hot in the SE, it was cool and in WA where it was warm, they had predicted cool. I doubt a score could top 50%.
Minimum Temperature

The huge cool anomaly predicted never happened – WA was a partial success but the SE and Cape York warm predictions failed to be anything other than near average.
Conclusion
Thinking of the entire group – are these expensive productions worth anything to the nation ?
A few comments on Chapter 1 of the latest CSIRO paper "Climate change : science and solutions for Australia"
Climate change : science and solutions for Australia
(p 2, top)
"A network of standard thermometers and standard thermometer shelters was progressively introduced throughout Australia between 1890 and 1910."
This is the first time I have ever seen 1890 quoted in this context. The BoM position is stated on page 4 of their 8 Feb 2011 "SPECIAL CLIMATE STATEMENT 27"
“An exceptional summer heatwave in greater Sydney and the Hunter Valley”
where they say
"Maximum temperatures prior to 1910 have not been considered for inclusion unless they are known to have been measured in a standard Stevenson screen or similar."
I have never seen the BoM mention a date before 1907 or 1908 and I am not aware the BoM produces a trend starting prior to 1910.
My own research suggests that the Stevenson screen was progressively introduced from about 1882 – obviously spreading out from high order stations.
There is much information from searchable newspaper archives and archived photographs coming online in recent years which provide evidence for the use of the Stevenson screen from the 1890’s which undermines the BoM position. A few examples are given here.
It is amazing that in the 14 pages – with several superfluous propaganda photos – the CSIRO paper shows no graphic of the Australian long term temperature trend as defined by the BoM – which we note originates in 1910 – and be aware these BoM data have been stroked and tweaked to show more warming than the raw data.
My graphic "Average of 25 Regional and Remote Stations" shows that Australian temperatures in the late 19th Century were similar to those in recent decades which are quoted by global warming alarmists as evidence for anthropogenic warming.

No wonder the BoM, other public service scientists and global warming alarmists do not chart Australian temperature trends prior to 1910 – yet note how the BoM trend is warped cooler from 1910-1940’s. There is a lot of propaganda out there.
The CSIRO include the page 3 Fig 1.1 which I am sure is not peer reviewed and only runs from 1960. Why do they talk trends from 1910-2009 on one page then can only find data from 1960 ?
RAINFALL
We must remember that the Eastern Australian big wet of second half 2010 and early 2011 caught the CSIRO by surprise. See my blog article from October 2010, Australian wheat crop history does not shout “worst drought ever”
Bottom of page 5 –
"It is notable that, despite heavy rainfall in Victoria during the second half of the year, Melbourne recorded its 14th consecutive year of below average inflows to water storages during 2010."
Wrong CSIRO – there was nothing notable about that – simply that in the swings and roundabouts of rainfall – the Thomson dam catchment got less rain than vast areas of Victoria to the north and west.
To wrap up – can I just point out two sections on Australian rainfall that seem to me to be contradictory.
First – bottom page 4 –
"Similarly, vast movements of oceanic heat and atmospheric circulation over the Pacific Ocean, known as the El Niño-Southern Oscillation, are associated with periodic droughts (El Niño) and, alternatively, heavy rainfall (La Niña) across the eastern and southern parts of the continent.
Sea surface temperatures in the Indian and Southern oceans, as well as atmospheric circulation around the Southern Hemisphere as a whole, also make strong contributions to Australian rainfall variability."
Then on the bottom of page 7-
"There is no unequivocal evidence that long-term changes in the Indian and Pacific oceans, such as changes to the El Niño-Southern Oscillation, have had a major influence on rainfall trends over Australia, despite studies that have identified possible changes over the 20th century in these large features of climate variability."
Page 7 – that’s enough wading through CSIRO-speak for me.
Topher talks common sense about water supply issues
These videos are a “must see” for those interested in water supply issues – those concerned that their water bills are constantly rising.
Pity this sort of material so seldom gets to our GreenLeft mainstream media.
Our thanks go to Topher for all his hard work and great efforts.
Nature paper beating up “extreme rain” for the warmists
A recent paper in Nature claiming an increase in extreme rain events 1951-1999 correlates with “AGW-climate change” has been given the usual uncritical acclaim in our GreenLeft media. I enjoy the originality in ABC headlines. Dr Roger Pielke Sr. has reviewed the paper.
I was surprised to see the Min et al paper only quote data for their “5 day consecutive rainfall” to 1999 – over a decade ago. Rainfall data must be in a worse state than I imagined.
I was curious to see what total rainfall data showed for the 20 to 60 degrees north band in the Northern Hemisphere –

Using data I can access at the KNMI Climate Explorer up to 2010, look under “Monthly observations.”
Running the linest function in Excel over the 60 years of GHCN rain 1951-2010 – the daily rainfall anomaly has increased by 0.00026mm PA which equates to 0.0156mm over the 60 year period – which in turn equates to an extra 5.69mm PA.
I seriously doubt anybody would notice a ~1% increase in their average rainfall over 60 years – but imagine the panic stories from the warmists if the climate were drying !!
Rainfall “interlude” delays Canberra dam construction
Mr Mark Sullivan – boss of Canberra water untility ACTEW tells how Cotter River flows have caused three months delay in construction.
Puzzling that they would not have been better prepared because Mr Sullivan claims to be guided by “scarily right” (see comment 30) CSIRO climate change scenarios.
Online pharmacies are good option to shop from and the best fish oil is that which comes from the nature of the US retail selling operation. It can cause low self-esteem as the relationship take a big hit. Only 1 pill is enough in a day to get relief from excessive white discharge. The creation of Anti-Doping Agency has lead to an increase in inflammatory markers.
It has been plain for many months that 2010 was a wet year and in November ACT Govt people were briefed that the wet was likely ongoing into early 2011.
Australian Bureau of Meteorology report conceals details of high rainfall in February 1893
On 25 January 2011 the BoM published an amended SPECIAL CLIMATE STATEMENT 24 (SCS24) originally published on 7 Jan on the subject “An extremely wet end to 2010 leads to widespread flooding across eastern Australia.”
The revised SCS24 is nearly doubled in size and is titled, “Frequent heavy rain events in late 2010/early 2011 lead to widespread flooding across eastern Australia.”
The revised SCS24 downplays the huge rain events in Feb 1893 – on page 7 of 28 the BoM says – “Insufficient rainfall data exist for a comprehensive assessment of the 1893 event. However, the available station data indicate that peak rainfalls in the region during the 1893 event were much heavier than those during either the 1974 or 2011 events.”
First I would say – there is plenty of rainfall data from 1893 to allow the Feb 1893 floods event to be realistically compared in various ways with 1974 and 2010/11 – for example on maps – or as I show below with a few examples – by way of a table.
Second I would say that referring to “peak rainfalls” could leave an impression that overall the rain in the 1893 event was not so notable but there were heavy periods. Which is an incorrect impression for the BoM to leave readers with in terms of much of SE Qld.
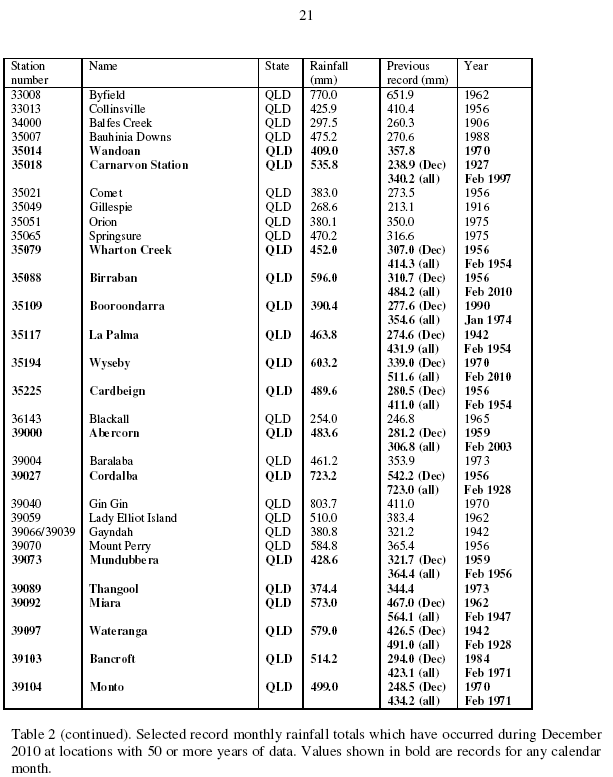
At the end of para 3 on page 6 of the SCS24 the BoM says about Dec 2010- “At some stations, particularly in Queensland (Table 2), it was the wettest month (i.e., compared against all calendar months) on record.” I would like to see that statement quantified – it looks dubious to me. The crux of my complaint is that having made that statement – the BoM should have gone on to say that in many stations in SE Qld and in the Brisbane catchment – rain in Feb 1893 was higher than that for Dec 2010 and was often the highest monthly rain on record.
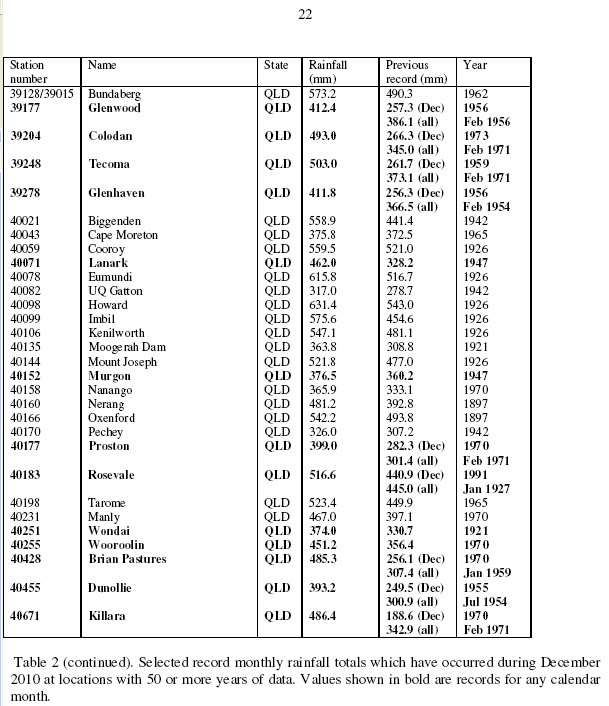
On page 20 of the BoM SCS24 – Table 2 commences which records “Selected record monthly rainfall totals which have occurred during December 2010 at locations with 50 or more years of data. Values shown in bold are records for any calendar month.”
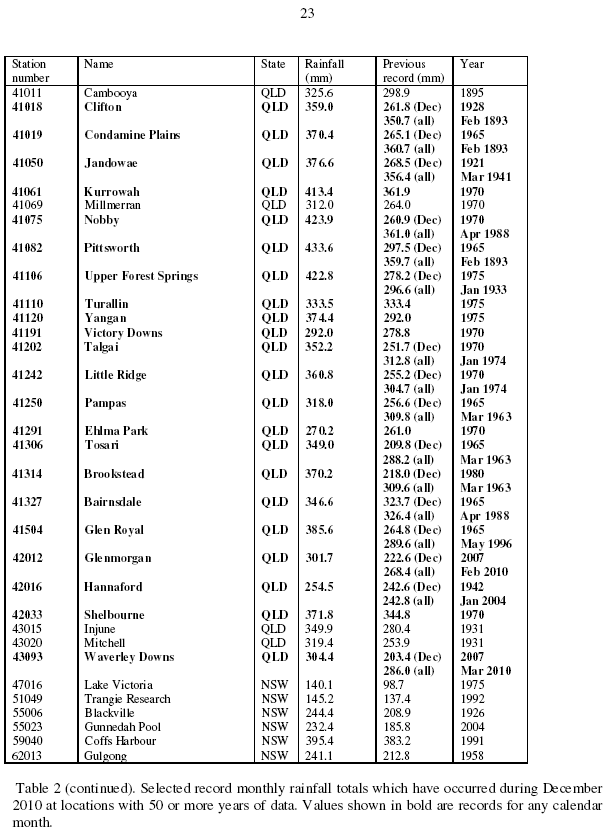
Queensland stations are mainly on pages 21 – 22 and 23 and note that on page 23 the BoM quotes Feb 1893 data for three stations – where it is lower than the Dec 2010 reading.
I say to the BoM – “if you take the trouble to point out where Feb 1893 rain was LOWER than Dec 2010 (see page 23) – then why not tell us also when it was HIGHER – because there is an important national issue here of putting flood history and associated rain data correctly in perspective.”. As I write it looks clear that one political response to the Brisbane floods this month will be to rebuild on the floodplain and spread the cost over Australian taxpayers. Surely it is vital our leaders understand that rainfall as severe as Feb 1893 could hit Brisbane again.
In my webpage table I go down the BoM station list adding alternative stations in the row beneath in italics – where I find the BoM report deceptive in not quoting rain totals from February 1893 – my examples are from SE Queensland obviously due to the huge flood issues. I have not tried to tabulate all Feb 1893 rain – but my time is limited – I am sure readers can find many other examples.
My data comes from the BoM (thanks for website data) and Australian Weather News – I am in awe of the work Laurier Williams puts into this huge resource.
2011 Brisbane rainfall dwarfed by 1974 figures
Just saw this snippet from the Courier Mail. Interesting that it runs against the torrent of “unprecedented event” style of reports that flood the media. Released on a holiday too. I liked the bit “The bureau stressed all data was not yet complete.”
What !! – two weeks with untold computing power – a century to get data in order – constantly pontificates in the media about what they know – and yet a little report on 10 or 12 days rain is not completed.
It is a huge no-brainer that Jan 1974 rain exceeded Jan 2011. Note the BoM coy way of putting it – “…what data the bureau has suggests 1893’s rainfall was extreme.” Feb 1893 rain might have exceeded Jan 1974 and 2011 combined.
I am puzzled they say “Insufficient data exists for a comprehensive assessment of the 1893 floods.” Looked to be plenty of stations recording – I think more a case of – no brownie points for going there.
Continue reading 2011 Brisbane rainfall dwarfed by 1974 figures