Just saw this on WaterCorporation www. click on Sources then Future

Last month I updated my Perth dams catchment rainfall and it is plain that Perth catchments rain is similar to levels of 40 odd years ago (May to Oct av now ~850mm). Will add more later on the 20+ years history of the WA Govt. avoidance of valuable rainwater that falls free from the sky. Every May to Oct. on average 2,975GL of rain falls over Perth dam catchments and if catchment bush was managed so that only 5% of that water was harvested as dam inflows that would mean 148GL PA which is ~52% of Greater Perth annual consumption – ~ a $Bill worth of water.
Interested in the link you give about the intended/ proposed use of desalination.
I have understood that the desalination plants around Australia were not currently in commission. Is this the case today or am I short of the 8 ball here?
Cheers
Roger
Perth pioneered large scale seawater desal in Oz. Yes Roger I think you are correct in that none of the eastern States desal plants are in full use – most mothballed at colossal cost.
In 2006 the Kwinana desal plant commenced which could produce 45GL PA. In 2013 the Binningup plant north of Bunbury was opened with a capacity of ~100GL PA.
Parallel to the above and starting before 2000 water authorities and politicians for political reasons choose not to manage catchment bush and maintain dam inflows as a percentage of rain. Avoidance of stirring up Greens opposition at the ballot box seems to have been the main reason I can see. All this against a background that Perth region and SW WA rain was higher before ~1975 see BoM chart here.
www.bom.gov.au/climate/change/index.shtml#tabs=Tracker&tracker=timeseries&tQ=graph%3Drain%26area%3Dswaus%26season%3D0112%26ave_yr%3D0
WA pollies and watercrats choose to run with the idiot notion that “climate change stole our rain”. The slogan “our drying climate” must have been printed and repeated thousands of times.
Ignoring of course that there are other examples around where a region has seen a significant rain increase.
Like Northern Australia about the same time –
www.bom.gov.au/climate/change/index.shtml#tabs=Tracker&tracker=timeseries&tQ=graph%3Drain%26area%3Dnaus%26season%3D0112%26ave_yr%3D0
and NSW post WWII – put in 10 yr av.
www.bom.gov.au/climate/change/index.shtml#tabs=Tracker&tracker=timeseries&tQ=graph%3Drain%26area%3Dnsw%26season%3D0112%26ave_yr%3D10
Back to Perth region – For some history an important press article 2002 Roger
Water bosses “snubbed” plan 3Aug2002
www.warwickhughes.com/water/thinning.html
In 2007 when I lived in Perth I blogged –
There never was a rain shortage to justify seawater desalination for Perth’s water supply
www.warwickhughes.com/blog/?p=145
there is a little 3 page pdf there giving a quick sketch of the situation. I must update all this.
Authorites knew what to do Roger – trials had been run.
Effects of catchment thinning at Higgins near Dwellingup from WaterCorporation online report (3rd graphic)
www.warwickhughes.com/pwu/where.html
In 2007 I also blogged – Perth is not running out of water, water is running out of Perth
www.warwickhughes.com/blog/?p=127
there are other SW WA rivers too where weakly saline water wastes to the sea. Some could be desalinated for fresh supplies vastly cheaper than desalinating seawater.
There are independent proposals from almost 2 decades ago to boost Perth water supply
“Plans to reduce WA wheatbelt salinity and utilize Wellington Dam” 15 May 2016
www.warwickhughes.com/blog/?p=4482
WA Govt has stolidly opposed the no-brainer Wellington Dam project for over a decade now.
I must update all this material onto one www page timeline now the dam decommissioning looks official.
Not sure I fully grasp this, Warwick.
Are you suggesting that the WA Govt, under Green goading, is deliberately removing water storage dams in favour of desalination ?
Or, in short, let the rivers “run free” and rely on wind and sunbeams to wrench distilled water out of the ocean in sufficient quantities ?
You have nearly got it ianl8888 – Green goading was little required – both parties fell over themselves crawling to the votes on their Green fringes. Obviously we all know about ALP/Greens preference swaps but many in the east may not be up with the threat of green “Doctors Wives” to otherwise safe Liberal seats. Perth also has the influential Conservation Council of Western Australia stacked with ex public servants which is a force.
www.ccwa.org.au/
The dams are not (yet) being removed as some are still required to store desalinated water and of course Mundaring feeds the water pipeline to Kalgoorlie. Just as well they built that over a century ago – could never be done now. Of course the dams catch rainwater inflows too but authorities do a good job of bad-mouthing and obfuscating that.
What authorities/Govts have done is abandon the management/thinning of catchment bush which has been reducing inflows for over 20 years despite trials have been run showing the beneficial effect of bush thinning. We are not talking clearing catchments just thinning some understorey to get inflows back around 5% of rain. There would be advantages re fire risk too.
Barking mad would be a succinct way to describe Perth water supply policies.
I say in the blog “Will add more later” – I intend building a www page pulling together all the disparate material from ~2000 onwards into a timeline of the whole saga.
I am also planning another open letter to WA Minister and watercrats.
Speaking about increasing rainfall in the north, we just had a record January with 915mm, eclipsing 1997 by 5mm. This comes after last years wet season December 2016 record rainfall.
The annual average for Broome is just over 600mm.
Roebuck Plains (West Roebuck) January rainfall was well over a metre, and what people often called a 100 year event seems to happen at least every 20 years.
The highest daily rainfall was in January 1917 at Roebuck Plains of over 560mm.
Those Broome rain numbers remind me of Colin’s Canal proposal which I see even has a wiki.
en.wikipedia.org/wiki/Kimberley%E2%80%93Perth_Canal
The lack of any effective control burning in Melbourne’s catchments means the present fuel loads are a massive 1939 style conflagration waiting to happen. When/if fire does destroy a large proportion of these catchment forests, expect water harvesting to take a massive hit a few years later as the vast new growing forests soak up near double the water a mature forest needs.
There were fires in Canberra catchments early in the 2000’s Bob mainly 2003 – google will find stuff. I think water was sourced from Googong for a few years while the Cotter catchment bush regrew but I am not across details.
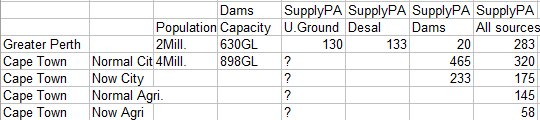
News about Cape Town on track to running out of water in April is attention grabbing and I have started a comparison with Perth. Some data from the Weekly pdf at bottom of page. Perth data from WaterCorp Annual Reports. I expect to blog more re Cape Town later. Note the Cape Town dams supply some water for agriculture.
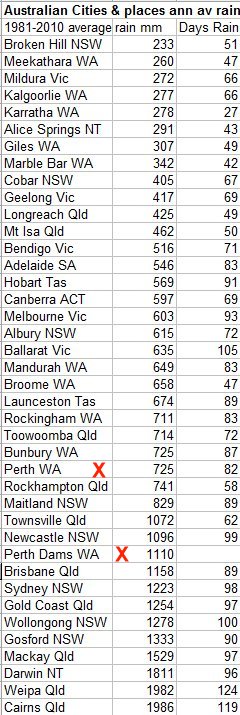
Table of Australian cities & places ann av rain – I added more sites. Shows Perth not so dry.
Remember Tim Flannery and his dumb warmist quote. It will never rain enough to fill our dams.
How many billions of dollars did that cost the taxpayer
We need a leader like Trump to kick some of our overpaid government consultants, scientists who deliver bullsh-t info to our gullible green leaning pollies
Dear old Dr Tim Flannery from winter 2004 with his “Perth will die”, monster fail by now I guess.
www.warwickhughes.com/water/twa25jun.gif
Crikey Perth Dams are wetter than Townsville!!
BTW – some notable cool temperatures from WA lately.
WILUNA (013012) smashed the lowest Feb min at 8.9 on 1 Feb prev was 12.1 data from 1957
LAVERTON AERO (012305) smashed the lowest Feb max at 16.8 on 1 Feb prev was 18 data from 1991
1) ” … the threat of green “Doctors Wives””
Oh yes, we know this well. The NSW State Libs are full of this destructive, guilt-driven, syndrome. In fact, middle-class guilt is the driving political force that is destroying us – summarised as “Our comfortable life is built on destroying the planet”. No hope of neutralising that manifestation of free-floating guilt.
2) People (some) constantly mock Flannery, but he actually helped stoke the guilt syndrome noted above. This exaggeration, outright deceptive badgering, was done deliberately with calculated consequences. In short, Flannery volunteered to accept mockery from the few in order to propagandise the many. Worked too.
Over this side too, Warwick. Casino had its coolest Feb day on record on the 2nd, along with towns just over the border in Qld.
Thinking back to post 2000 when Labor won the 2001 WA State election making Geoff Gallop Premier; doctors wife Janet Woollard won the Liberal heartland seat of Alfred Cove under the banner of Liberals for Forests.
en.wikipedia.org/wiki/Janet_Woollard
Then 2001 turned out to be a dry year and of course dam levels fell and I think the new Labor Govt hit the panic button a bit re water policy. The fact that the next 4 years had fair rain did not stop those slogans being generated, our drying climate, run of dry winters and even, we are in permanent drought – all linked to “greenhouse climate change” and boosting the Labor and “watercrats” thrust to seawater deasalination.
A Perth correspondent has emailed to say “I was listening to ABC radio while driving this morning and an eastern states professor was being interviewed about WA water assets. He quoted some incredible stat that 90% of the rainfall over the catchments does not make it into the dam holding. I will endeavor to see if there is a podcast of the interview. The quoted stat is either disingenuous or damning of the lack of catchment management. A point that was not addressed of course.”
Does anybody have an idea who the “professor” was? I can not recall anybody in the news here talking Perth water issues.
BTW more like 98 to 99% of Perth catchments May to Oct rain does not make it into dams in recent years. Last year was sl better and near 97% of rain did not make it to dams.
Open email just sent to Ms Sue Murphy the CEO of the WA Govt Water Corporation in Perth.
Open Email to CEO Ms Sue Murphy
Dear Ms Sue Murphy,
CEO Water Corporation, Perth
I was reading your CEO’s Year in review page in your 2017 Annual Report.
I am amazed at your cherry picking data and conveying of misleading impressions.
My advice would be to withdraw the 2017 Annual Report then you should compose a more balanced CEO’s “Year in review”.
I have a www page –
www.warwickhughes.com/water/sue-murphyFeb2018.html
which sets out my critique.
I also have a related www page commenting on multiple BoM charts of long term rainfall trends for various Australian regions and States.
www.warwickhughes.com/water/ozrain17.html
I look forward to you re-writing your 2017 “CEO’s Year in review page”
I will be forwarding this email to various MP’s and Ministers both State and Commonwealth.
Any response you make I intend to publish on the internet.
Yours sincerely,