Where has all the water gone ?

Water Corporation (WC) online Perth dams rainfall totals indicate that in May 2005 an average of about 220mm of rainfall fell on our catchments.
With 3500 squ km of catchments this equates to about 770GL of water, over twice Perth total annual consumption.
It is surely a valid question to ask "where has this water gone ?",  in order that there be greater public understanding of Perth water supply issues.
Perth dam levels 2005
Looking at the WC website graph of dam levels we see that there has been a very tiny rise in dam levels through May of one or two GL.
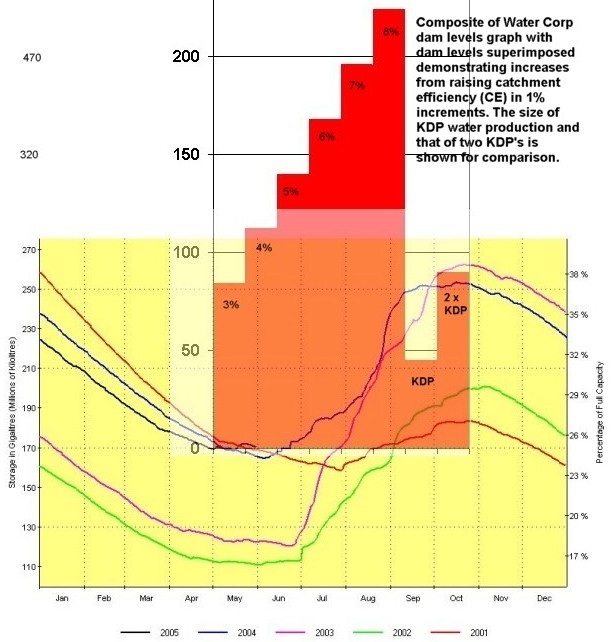
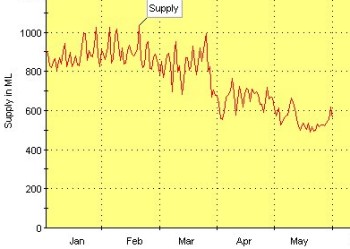
Through April dam levels fell about 8GL yet consumption averaged about 650ML per day totalling say 19.5GL for the month. Presumably groundwater made up the shortfall of say 11.5GL.
As May starts with early heavy falls we see the dam level graph kick up sharply a GL or two before it equally sharply begins a steady decline which lasts till about mid May.
Was this first "beating back" of the rising graph due partly to cutting off groundwater pumping ? Say 10GL for the month.
Perth daily water supplied
This WC graphic of daily supply shows May consumption averages maybe 550ML per day totalling say 17GL and we assume groundwater pumping ceased early in May, then our water used/saved from 770GL of rain falling is only about 19GL or ~ 2.47%.
Perhaps some water was used to fill reservoirs around the city and region. 
Is there any way water is shuffled around so as not to show on the WC dam levels graph ?
WC should explain more.
Was there any increase in environmental flows ?
Effects of catchment thinning at Higgins near Dwellingup from WC online report
Higgins catchment thinning

Looking at the above  WC graphic of the increased runoff due to catchment thinning at Higgins near Dwellingup, let us assume that Perth catchments have been managed to a state where runoff averaged 5% of rainfall.  This is a figure WC state as being a current average, so if in May 2005 CE was what WC say it is, 5%.  An extra 19.5GL would be in dams, in just ONE month.
If one looks at the Higgins graph 8% looks like a moderate level to aim for and if this degree of catchment management was in place then our dams would have already  harvested another ~42GL in May.
Let us be clear what this means; in one month our Govt. neglect of basic catchment management in recent years has just WASTED  water equal to 93% of the projected KDP production.

Now we can see the scale of water waste currently going on compared to planned annual production of 45GL from the Kwinana Desalination Plant (KDP).  For which we have to invest $387Mill and rising, plus pay heavy operating costs, water costs will be permanently higher, there will be ongoing environmental impacts and our electricity generating system will be more stressed than it need have been.

The Premier claims we will be "independent of rainfall", what stunning success he is having.

Reconstruction demonstrating 2004 dam levels with increments of increased catchment efficiency (CE)
Composite effect of raising CE on Perth dam levels

To drive home how clever Govt. water policy is,  just quickly let us look at a composite graphic demonstrating what extra water would have been caught in our dams in 2004 if catchment efficiency had been raised in past years, we will use 1% increments to illustrate.
Based on 825mm of catchment rainfall Oct-May 2004 and catchment area at 3500 sq kms, leading to 2800GL of rain in 2004.   See graphic of CE from 1980 to 2004 demonstrating fall off in CE post 1996                           on PWU front page
The Blue trace at left shows 2004 dam levels, rising from just under 170GL in early June to peak near the 250GL mark by October. A total  of approx 80GL which just happens to agree closely with the stream inflow May 2004-Jan 2005 shown on the well known WC online graphic, "Yearly Streamflow for Major Surface Water Sources".

Could the WA Govt., backed and influenced by the Greens and no doubt influenced by Liberals for Forests,  be the worst water managers on the planet ?
Funny thing, Water Corp. keep claiming  in recent reports that CE is 5%, they do not seem to be aware that it has in fact fallen to 3% and under.
If they just got CE back to where they CLAIM,  2004 inflows would have been  140GL or  three times KDP production


Back to Perth Water Users front page