 | Before
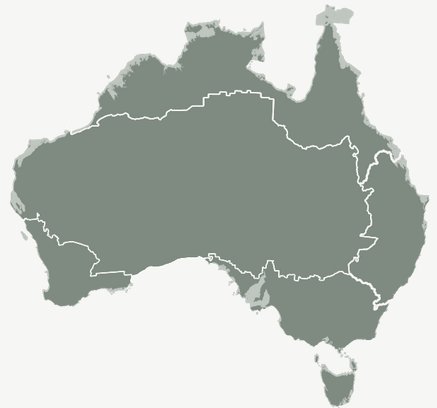
we start on rainfall charts here are the regions used by the BoM. Note
Southern Australia includes SW WA plus Tas plus the area of
Southern Eastern Australia. For a more detailed discussion of the regions see this Climate Change
site. I note the BoM has no rain trend for the vast area termed
Rangelands in central Australia. I am working on an Alice Springs
rain history from 1874 and will also look for other long term
rain data from the Rangelands. Vast areas of Planet
Earth are greening due to increased leaf area according to this NASA map of satellite data from 1982-2015. |
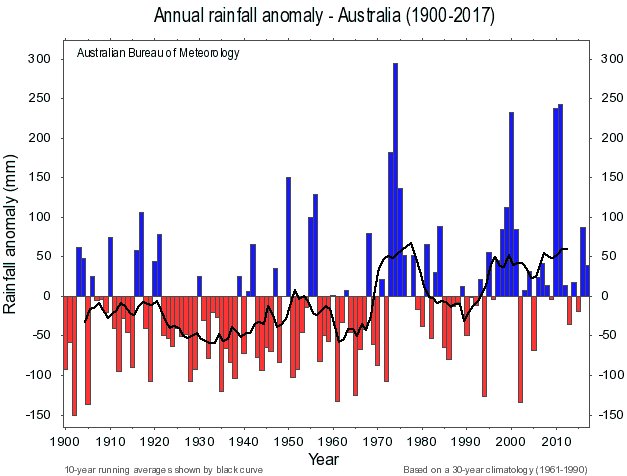 | There
can be no doubt Australia is enjoying more rain after the early 1970's.
Interesting the Millenial drought does not show big. But our
parents and ancestors had dryer times to cope with. There is a sign of closer to normal conditions pre 1920.
Most of our charts begin in the Federation Drought which is said to have started in 1895.
In
many Australian regions and States there was very poor rain from the
~1920 to the end of WWII. I wonder if this could be termed The Great
Depression Drought.
Climate research refers to the 1970's Pacific climate shift see this 1992 paper by Richard Kerr which draws attention to the PDO (Pacific Decadal Oscillation).
I think it is likely that the reasons for the often seen ~1970's
changes in rain from various Australian regions lies with
poorly understood oceanic and circulation factors that
caused the 1970's Pacific climate shift. |
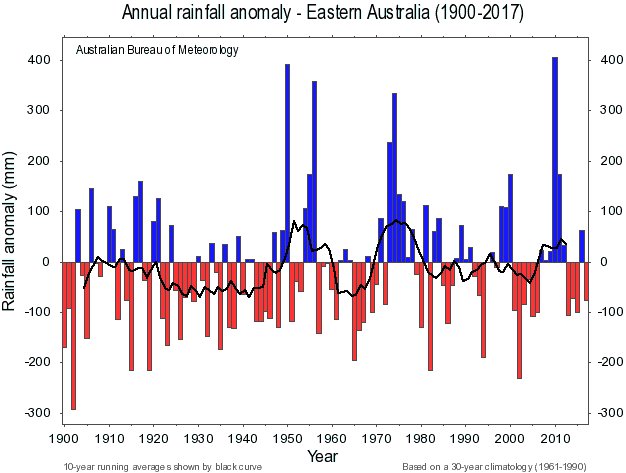 | Eastern
Australia had a dryer climate before WWII. The early 1970's was the
wettest period. Again the sign of closer to normal conditions pre
1920. |
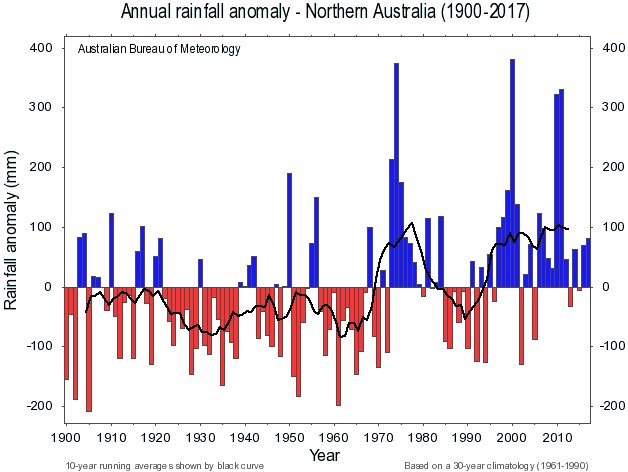 | Looks
like our monsoon strengthened in the early 1970's. (Due to CO2 of
course) I wonder if we
have been using this improved rain to best economic effect? And
again the sign of closer to normal conditions pre 1920. |
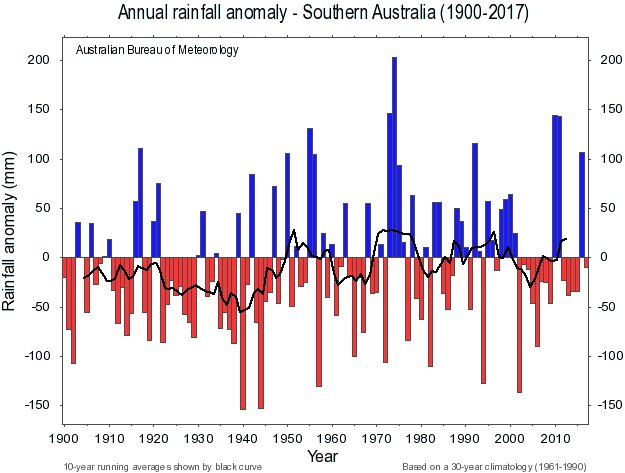 | The
climate prior to WWII was the dryest period for Southern Australia.
Be warned that Southern Australia includes the SW WA region.
Which is then counted twice in this series of charts |
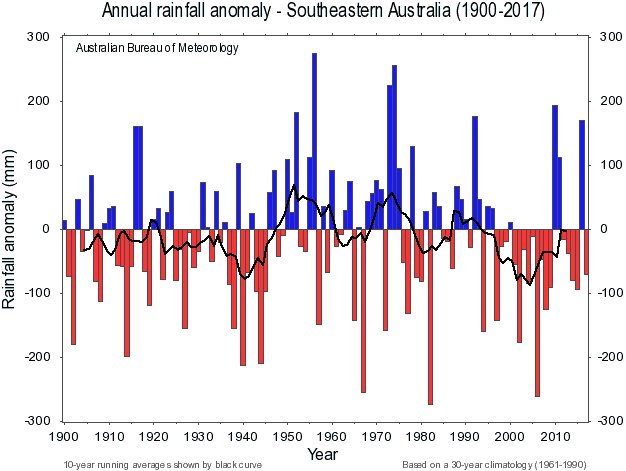 | The
Millenial drought has been the dryest period for SE Australia and the
years from the end of WWII to the early 1990's have seen the best rain. |
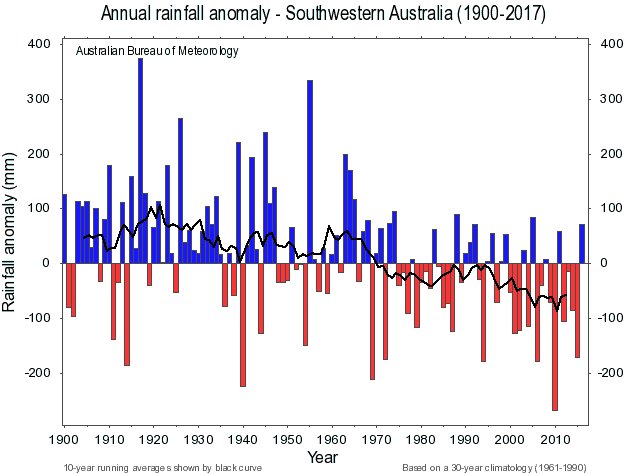 | SW Australia rain shows a long term decline. |
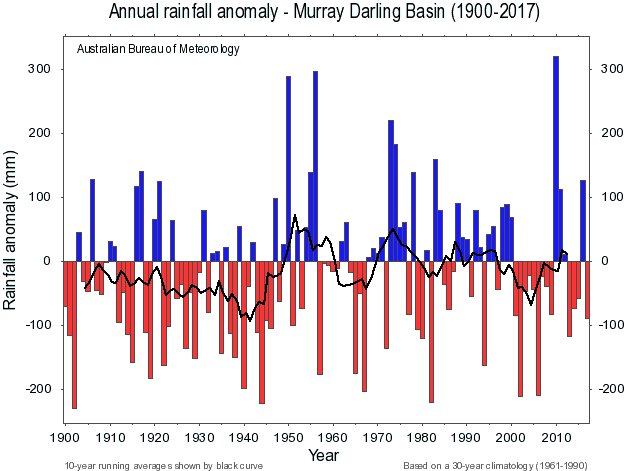 | The MDB climate was dryest before WWII. |
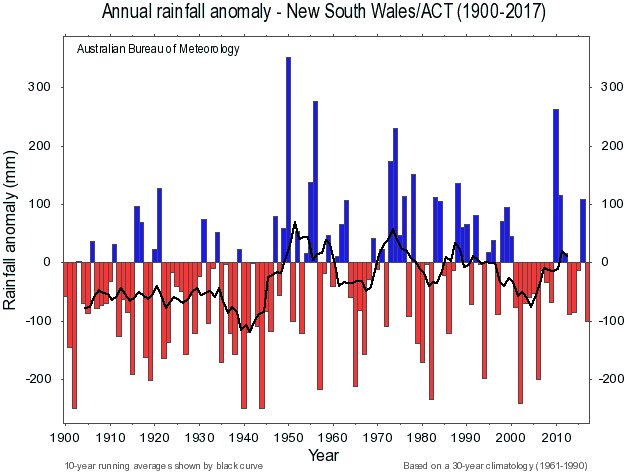 | The NSW climate was dryer before 1950. Can I note that there was cloud seeding carried out after WWII. |
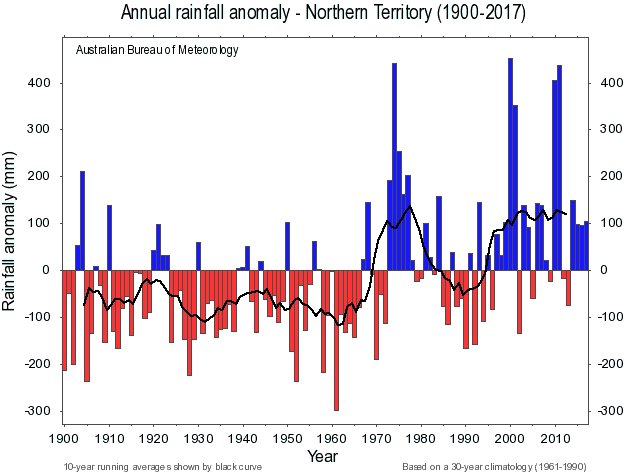 | The NT climate was dryer before the early 1970's. |
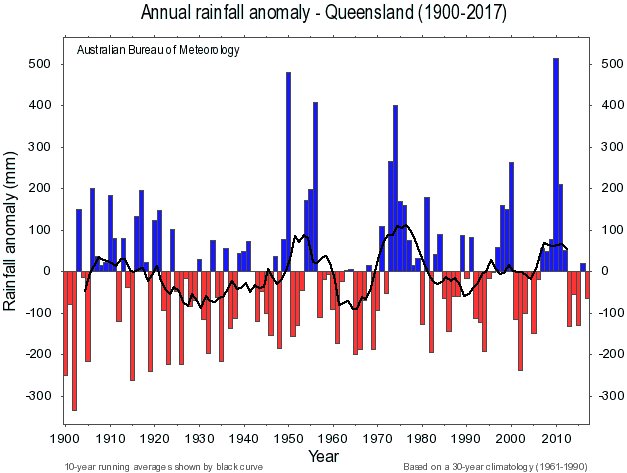 | Qld shows the interesting slightly wetter than normal period before the early 1920's. |
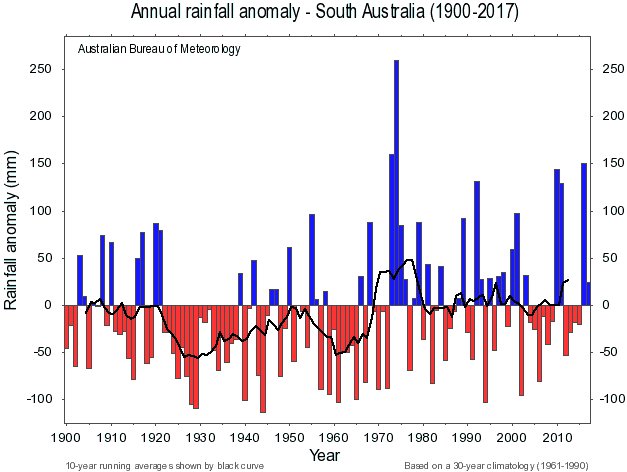 | The
SA climate was near normal pre-1920 and enjoyed the best rain in the
1970's. Rain seems to be on the improve in recent years. |
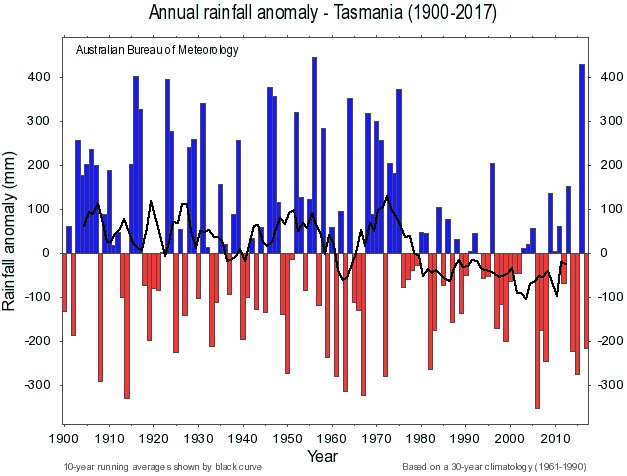 | Tas shows
a change to dryer conditions from about the mid-1970's. 2016 was a wet
year no doubt welcome after dams were run down following the BassLink
failure. |
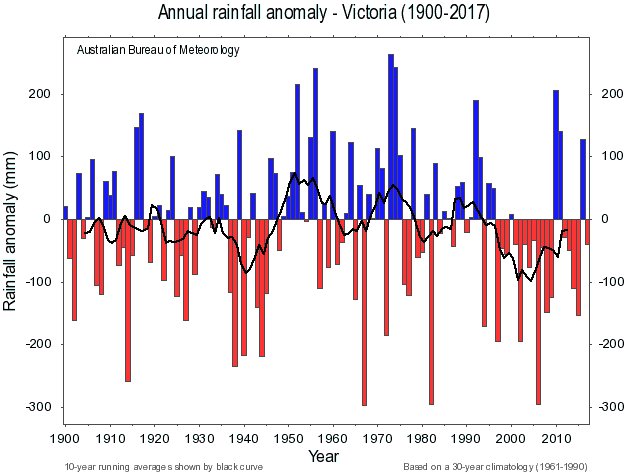 | The
Vic climate has been relatively dry before 1950 and again after the
mid-1990's. Who understands these decadal changes in rain? |
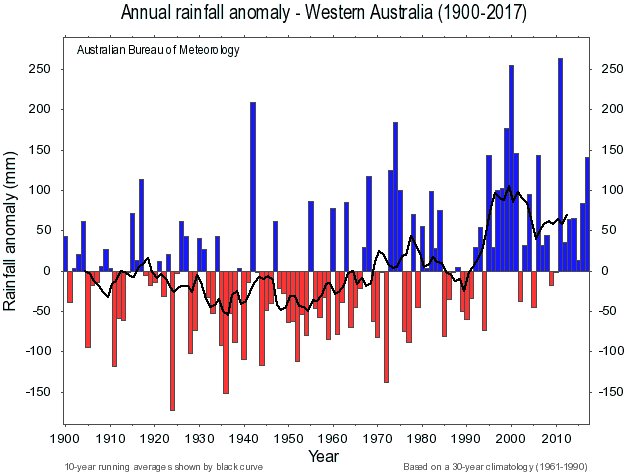 | The WA climate has got notably wetter after 1990, also with the normal signature pre-1920. |
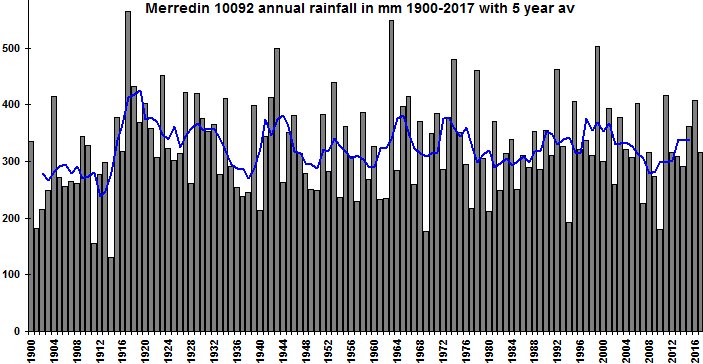 | Chart made from data at the BoM CDO Note the low rain years pre WWI. What caused that jump in rain in 1917? We know so little.
Just as well "climate scientists" know so much!! |
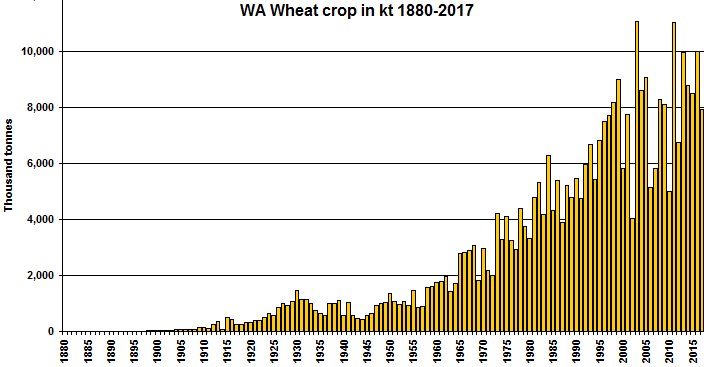 | The
WA wheat crop does not seem to have got the message that rain is in
continual decline. Yeah yeah I know technology, improved
fertilizers and farmer hard work and cunning have beaten the declining
rain trend. Knocked it for six. |