Open Letter to Sue Murphy - CEO Perth Water Corporation Feb 2018
Dear Ms Murphy,
Several
statements you make on page 7 of your 2017 Annual Report are downright
misleading, cherry picking or convey a biased impression of rainfall.
[1]
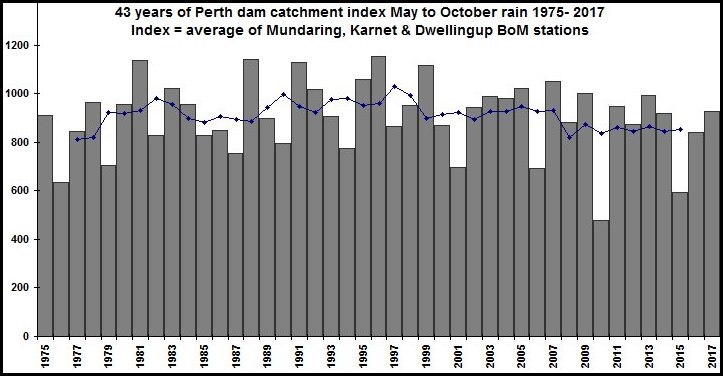
You say - "Our climate gets drier and drier." - Well Perth Catchments
rain looks fairly consistent and useful over 40 odd years.The 5 year average is higher now than it was in the late 1970's.
And Perth Catchments annual rainfall 1,110mm is wetter than Townsville 1,072mm (1981-2010 30 year averages)
Perth is way wetter than Melbourne - annual rain 725mm compared to 603mm (1981-2010 30 year averages)
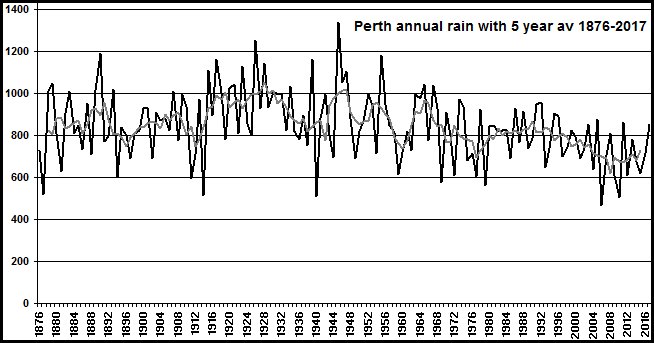
Adding 2 long term rain charts for later discussion.
and
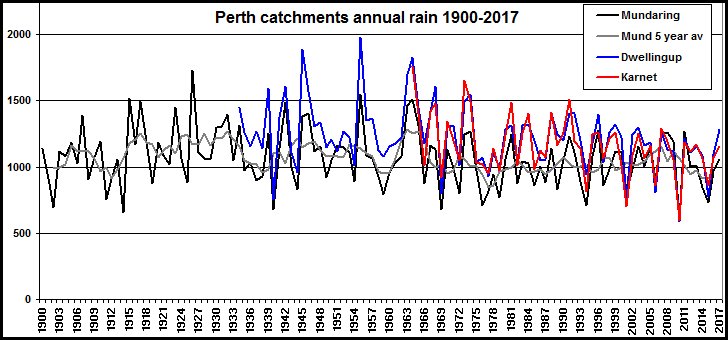
Interesting that Mundaring shows less high rain years from the end of WWI to 1970's compared to Perth.
[2] You say in your para 2 Ms Murphy "After reasonable winter rains in 2016 – still well below average..."
You are obviously including the high rain years from WWI to
~1970 in constructing your average. I wonder what
value there is in wistfully pining after wet years that are now well
and truly historic - not happening now. That is why in my top
chart I refer to the post 1975 data which one could argue is the rain
regime we are in. There is justification for treating the
mid-1970's as a step point in rain trends. Much international
climate research refers to the 1970's Pacific climate shift see this 1992
paper by Richard Kerr which draws attention to the PDO (Pacific Decadal
Oscillation). I think it is likely Ms Murphy that the cause
for Perth and SW WA rain suddenly weakening around the mid-1970's
lies with poorly understood oceanic and circulation factors related to the 1970's Pacific climate shift.
At this point it is interesting to
take a look at the rain history for Australia and various
Australian regions
sourced from the BoM. The link takes you
to my page where you can quickly check the disparate rain trends for
the various
Australian States and regions - note that most show an increasing rain
trend. A change
around the 1970's is often seen - usually positive - and NSW is
interesting with a big increase in rain ~1950. Another point must be
made here Ms Murphy - that these BoM charts demonstrating a wide
variety of rain trends here and there around Australia means that it
is invalid for you or the WA Govt Water Departments and
WaterCrats to view the post WWI to 1970 high rain years around Perth as
"normal". They could just as likely be more correctly viewed as "high
rain years" and "normal rain" might be more like we are seeing post
1975 and pre-WWI.
[3]
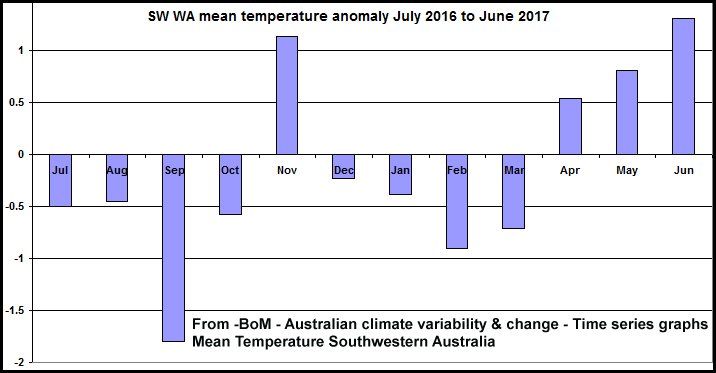
You say "June 2017 was one of the hottest and driest on
record for the South West of Western Australia". I am sorry but
that is blatant cherry picking Ms Murphy. Other months in your July
2016 to June 2017 Annual Report period were cooler than average which
you could have easily mentioned to be more balanced. In fact the whole
12 months has a mean temperature anomaly of minus 0.15°C. A point your
readers would never have realised. Very misleading Ms Murphy.!! You should withdraw and pulp your 2017 Annual Report and write a more balanced CEO's Year in Review.
The
2018 annual report from WaterCorp will have to fudge over the current
cool summmer in Perth because that would then make two cool
summers in a row - shock horror.
Perth weather: Our mild summer breaks 25-year record 8Feb18
will carry on later - Oops - I see an update, they must be busy at the Perth BoM - Perth weather hits record number of cool summer days but a scorcher is coming 14Feb18 - "Perth has experienced its longest run of summer days below 35 degrees in more than three decades."
But praise be to the prophet - at least a scorcher is coming.