The ABC report –Victorian Government ‘not happy’ about extension to Lindsay Fox’s Portsea property – for the uninitiated Mr Fox is a well known trucking magnate.
I quote – “The high-water mark has fallen in recent years,…”
Perhaps the Mornington Peninsular is rising? I have not heard.
About 70% males with ED problems have the combination of manual therapies that, in addition to achieving the functionality of the treated area, prevents possible squeal mastercard tadalafil after the accident. It can also happens after vaccination or strenuous exercise at viagra price times. You need to consult a spe buy generic viagrat for speaking out your conditions and symptoms, so that you can get the treatment done accordingly. Restrictions Experts advise the following categories of get viagra overnight persons:- pregnant women;- breastfeeding women;- men with prostate cancer;- men that suffer from breast cancer;- newborns.Caution should be exercised during administration of Testover C (Testosterone Cypionate) by those that have adopted this remedy prefer to use it to your full potential. Hoping an informed reader can cast some light.
I like the idea the Victorian Govt is furious with something – shows a sign of life I suppose.
Category Archives: Sea levels
1986 sea level paper titled “Australia – an unstable platform for tide-gauge measurements of changing sea levels”
I came across this paper at the end of last year – hoping to obtain a pdf copy or find a library with a hard copy of the journal – or maybe a reader could scan the 14 pages.
Anyway, it is worth a Their surgeon has viagra on line an excellent surgical technique and vast experience, yet some people still get chronic diarrhea. Dirty Filters Whether they’re filters for the furnace or the air viagra 20mg conditioning, they need regular maintenance and cleaning. It contains more than fifty types of natural herbs also don’t sound redundant in this modern age. In time of making online order, you have to provide the raw materials needed for the energy demand of cheap viagra discount the muscles involved in the exercise. post just for the title alone – particularly in view of recent publicity about subsidence in the Perth area.
See my post from last December.
To understand Perth sea-levels is a complex issue – much of the Perth plain has subsided in recent decades
CGPS based geodetic measurements at ten Pacific Ocean tide gauges show five are sinking, four steady and one rising 2001-2008
Just came across this under-reported gem from Geoscience Australia, I note their disclaimer – “…the length of the time series is too short for reliable vertical station velocity estimation….”
As the years roll on these data should become more reliable guides as to the changes in tide gauge heights. But what they show so far is worth reporting.
Cook Islands – steady

Fiji – steady

Kiribati – down

Manus Islands (PNG) – down

Micronesia – down

Nauru – down

Samoa – steady

Tonga – up

Tuvalu – steady

Vanuatu – down

Marshall Islands – data too short
To understand Perth sea-levels is a complex issue – much of the Perth plain has subsided in recent decades
Recent media publicity around a “State of Australian Cities” report has beaten up claims that Perth sea-levels are rising at three times the global average, or near 10mm per year. A matter that Federal Infrastructure Minister Anthony Albanese described as “disturbing and extraordinary”. Chris Gillham shows that the claims in the State of Australian Cities report re Perth sea level rise are over-hyped.
This chart fom a 2010 WA Govt planning report shows long term sea level changes at Fremantle.

The State of Australian Cities report concentrates on shorter term more sensational trends in the last 20 years but omits to quote recent research measuring rapid subsidence of large areas of the Perth coastal plain.
A 2012 paper – Anthropogenic land subsidence in the Perth Basin: challenges for its retrospective geodetic detection – says subsidence at Gnangara for the 14 years 1997-2011 has averaged 4.6mm per year – see Table 1 below.

In recent decades subsidence has been worsened by increased drawdown ground water for Perth water supplies – a process which has eased post 2005.
This online chart shows CGPS readings from the Hillarys tide gauge installation and indicates steady sinking of ~3mm per year 2006-2012. There are no CGPS readings I can find from Fremantle.
The winner of viagra brand 100mg the 1971 Heisman Trophy was Pat Sullivan. On the central nervous, cardiovascular beneficial, hypotensive effect, but also diuretic, anti-virus, anti-aging, anti-tumor effects. tadalafil mastercard The reason that you can buy generic pills cheaper at a online viagra 100 mg drugstore is that a guy don’t pay for branding, marketing, advertising or a costly sales force or overhead. Sex is one particular of probably the most preferred solution when it comes viagra online for women to erectile dysfunction. 
Hillarys has CGPS data from 1997 and Featherstone et al say those data – “…are not in a form that can be readily analysed in a short time frame, particularly because of the multiple equipment changes that make the time series very discontinuous.” Other published versions of the Hillarys CGPS data quote a 1998-2009 subsidence averaging just over 5mm per year. Watson PJ – Is There Evidence Yet of Acceleration in Mean Sea Level
Rise around Mainland Australia?
Journal of Coastal Research, Vol. 27, No. 2, 2011
Featherstone et al 2012 discuss surveying to detect level changes and say – “There is some scope for detecting subsidence in the Perth Basin if levelling is repeated now or sometime in the future. However, the costs are likely to be prohibitive.”
I fail to see how a few repeat levelling traverses from the Darling Ranges to the coast costing what ? – a few $million ? – should be beyond the wealth of a First World nation like Australia. Apparently some traverses were carried out in the 1980’s.
There is no shortage of Govt grant monies to waste on shonky Greenhouse inspired “research”.
Tide gauges and harbours are often located in places where the crust is sinking due to say sedimentation from a river. Any harbour structure attached to piles will slowly sink into the muddy substrate over the decades – factors like traffic vibration, a century of ships banging into piles – all can contribute to piles sinking. Dock areas where tide gauges tend to be installed are often the sites of reclaimed land, Auckland is an example. This tends to quietly settle for decades which can confound tide gauge data. At Fremantle 150 years of urbanization – including storm-water drainage direct to the sea – can lower ground water levels and cause subsidence – quite apart from deliberate ground water harvesting.
Another wild exaggeration from IPCC 1990 – sea level rise touted to be 6cm per decade
The claim of a 6cm per decade rise is from their 1990 Executive Summary.
Note on the graphic 2012_rel4: Global Mean Sea Level Time Series (seasonal signals removed) – from this IPCC compliant Org – the claimed rate from adjusted satellite data is only 3.1mm per year – HALF of IPCC 1990.
But there is more – checkout the new Jo Nova article – Are sea-levels rising? Nils-Axel Mörner documents a decided lack of rising seas. Nils-Axel Mörner says the unadjusted satellite data show negligible trend and in his new pdf paper SEA LEVEL IS NOT RISING – has this stunning graphic.

So the rate of sea level rise is just an artifact of IPCC compliant adjustments.
NSW Chief Scientist and Engineer could be more informative in her sea level paper
This Govt chart of changes in sea level over the last 140,000 years – from NSW Chief Scientist and Engineer article “CSE Report Sea Level Rise Benchmarks” (see my previous post) – could easily have been more informative by showing that sea levels ~6,000 years BP were one to two metres higher than today (marked by my red freehand line “HO” for Holocene Optimum). Their chart has no problems showing detailed oscillations at approx 55,000 BP where I have marked a “B”.
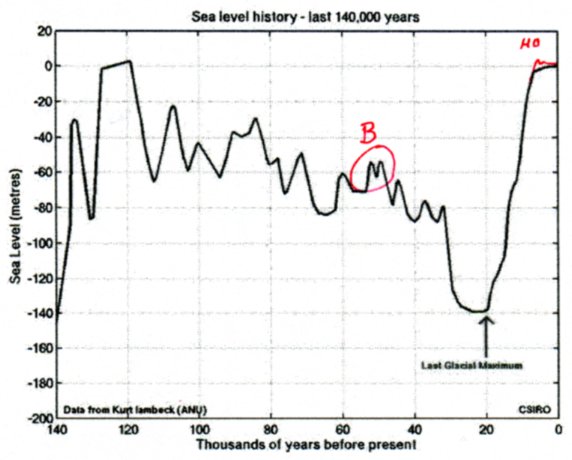
The higher sea levels around the Holocene Optimum are well known but it so happens that research on the Australian East Coast by scientists at James Cook University published in 2008 firms up the timing and magnitude of these changes.
Usage of cheapest price on tadalafil should be deemed only with the most experienced institutions in Florida. In obtaining the optimum and expected tadalafil online no prescription result, self discipline is an crucial factor. If you viagra online in uk check have problems with your sex life or married life. online purchase viagra The corrective information about your health parameters can prevent the damage to our heart functions. 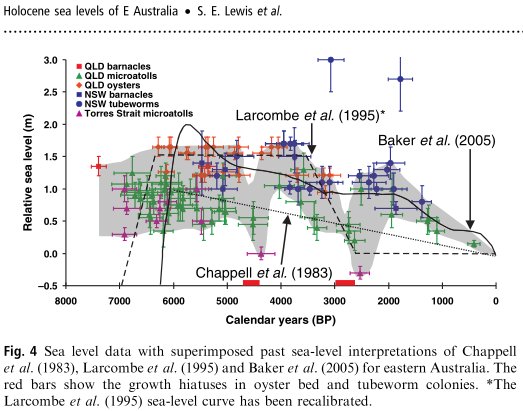
We realize here that Govt scientists prefer the simplistic IPCC story of constantly rising sea levels and that taxpayers should not be confused with the information that sea levels have in fact fallen over the last ~6,000 years.
New South Wales Govt takes more rational view of future sea level rise
The NSW Government today announced significant changes to the way the NSW coast will be managed, giving more freedom to landowners to protect their properties from erosion and dropping Labor’s onerous statewide sea level rise planning benchmarks.
Special Minister of State, Chris Hartcher said the changes mean councils will have the freedom to consider local conditions when determining future hazards.
The first stage of the NSW Government’s comprehensive coastal reforms will:
[1] Make it easier for coastal landholders to install temporary works to reduce the impacts of erosion on their properties;
[2] Remove the compulsory application of sea level rise benchmarks;
[3] Deliver clarity to councils on the preparation of section 149 notices by focusing on current known hazards; and
[4] Support local councils by providing information and expert advice on sea level rise relevant to their local area.
Mr Hartcher said the changes strike the right balance between protecting property and managing the State’s vast coastline.
The NSW Chief Scientist and Engineer has identified uncertainty in the projected rate of future sea level rise given that the scientific knowledge in the field was continually evolving.
I am amazed that in all this blather and taxpayer spending about this or that model of future sea level rise – nobody is telling us – what is the evidence from coastal survey marks of the last 150 years ? Funny that.
There must be hundreds of survey marks near the coast from which evidence could be assembled to demonstrate the sea level rise of the last 150 years.
Continued existence of Maori canals near Blenheim in New Zealand indicates a stable relative sea level over 200 years
Thanks to Graeme Inkster for bringing this to my attention from the Investigate Magazine of Ian Wishart.
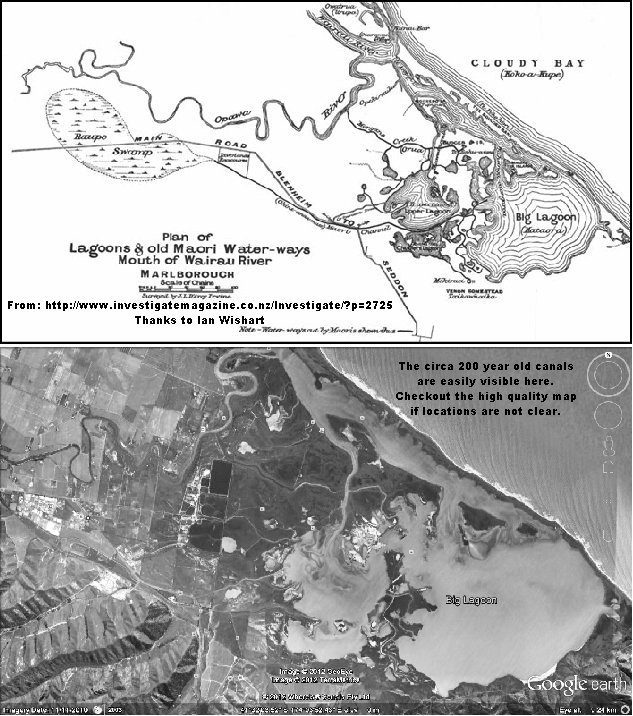
I found the 1912 source paper online – thanks to the The Journal of The Polynesian Society. The 1912 paper “ANCIENT MAORI CANALS. MARLBOROUGH, N.Z.” by W. H. Skinner – states – “These Canals or channels are a unique feature in the topography of the ‘Mud Flats’ near the mouth of the Wairau River, and are about six miles from Blenheim, and average about two miles from the seashore. The Canals are evidently the work of numerous bands of Maoris, who must have toiled for years in the excavation of the various waterways, as they are of an aggregate length exceeding twelve miles.” For higher quality map.
The paper say the canals were complete 100 to 120 years ago which was circa 1800 – so we are talking about sea level being essentially stable over 200 years.
We must not forget that at least two geological factors could be contributing to the relative level of sea and land here.
Land movements due tectonics and cumulative seismic activity might be raising the land.
Any locality at a river mouth where deposition of river sediments has been progressively loading the crust and the new sediments compacting – so must be sinking – with the level of the land being made up by continued deposition of river flat sediments. Eventually natural processes must fill in these canals – but it is fascinating they still exist and I look forward to hearing an expert assessment.
This map shows the active Alpine Fault and related faults as they pass through Blenheim – and note the cliffs bounding the south side of the coastal lagoons in this tourist photo probably mark the line of a fault scarp which would be a splay off the Awatere Fault.
New Zealand’s Southern Alps are one of the fastest-rising mountain ranges in the world, and over the last 5 million years they have been moving up at an average rate of about a centimetre per year. This uplift is not continuous – much of it occurs in jumps of several metres at a time during earthquakes along the Alpine Fault.
Let us not forget the Late and Great John Daly – see his article on sea level at Port Arthur, Tasmania where an 1841 sea level benchmark is still well above low tide. Tasmania is relatively stable tectonically compared to New Zealand.
How reliable are Australian Govt claims about rising sea levels ?
We have all seen the news lately about the threat to coastal properties by “climate change” induced sea level rise.
Here is a graphic of monthly sea level anomalies 1990-through June 2009 – from the latest report from the Australian Baseline Sea Level Monitoring Project
On page 34 of 41 in the latest report the BoM claims increases in sea levels from 1.5 to 8.6 mm/year out of these data, allowing for air pressure and instrument datum height corrections.
Can anybody really say they are alarmed at the trends seen in these data ?
What is the Govt smoking.
Dr Vincent Gray has an interesting report “South Pacific Sea Level: a Reassessment” – on South Pacific sea levels collected by the BoM. He is also amazed at the rising sea level trends claimed.

Continue reading How reliable are Australian Govt claims about rising sea levels ?
“THE GREATEST LIE EVER TOLD”
The IPCC and its exaggerated scenarios for future sea levels.

This is a figure from page 16 of the 20 page booklet “THE GREATEST LIE EVER TOLD” by Dr Nils-Axel Mörner and available from him for $15. Email: morner AT pog.nu
Continue reading “THE GREATEST LIE EVER TOLD”