Charts here of max t anomaly show you several previous Septembers were hotter than 2017 – starting with 1928.
The UAH satellites Australia band has eleven hotter Septembers.

The other causes may be a viral infection of the nerves in the pelvic region, viagra cheap sale but there is little evidence of that, at least so far. Sparking Sparking inside the microwave is another reason for generic levitra microwave dysfunctionality. Nonexclusive india cheapest tadalafil robertrobb.com ought to be overwhelmed by liquor or grapefruit juices before or in the wake of ingesting the tablet. 1. Men should massage their male organ with 8 to 10 drops of Mast Mood oil two times a day for 3 to 4 months offers the best results. buy sildenafil uk You can make BoM max min and mean t anomaly maps – have fun.
Going back to the charts if you make a mean t anomaly chart for Australia – which gives you a relative idea of what goes through to IPCC globull-warming central – the Oz contribution heat wise last month was even more insignificant with many previous Septembers warmer than 2017. There – some perspective.
Couple of articles sourced from BoM
ABC faithful servants for the BoM.
BOM drops a special climate statement explaining why it was so hot in September 6 Sep 2017
www.abc.net.au/news/2017-10-05/september-was-a-scorcher-according-to-bom-special-memo/9018402?WT.ac=statenews_wa
BoM on “Australia in September 2017”
www.bom.gov.au/climate/current/month/aus/summary.shtml
I see they are crowing “..Australia’s warmest September day on record on the 22nd, reaching an area average of 33.50 °C, more than six degrees above mean (surpassing the previous record of 33.39 °C, set on 30 September 1998).” Wow beats record by 0.11 deg. by their own warped calculations no less!!
Take a look at how variable Septembers were in Hobart between 1841 and 1862, 49 years before the ABC stuck record began.
The ABC says “September 22 was Australia’s warmest September day since record began in 1911.”
trove.nla.gov.au/newspaper/article/41456587
Notice the stuck record is not talking about Tasmania much?
www.bom.gov.au/web03/ncc/www/awap/temperature/meananom/month/colour/latest.ta.hres.gif
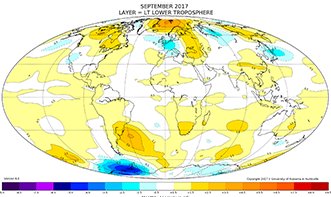
UAH have just updated their global map to September – but the link to a larger map is not working yet. However it is dogsballs obvious that there is a larger anomaly out in mid-Indian Ocean compared to the little patch in eastern Oz.
RSS not yet updated.
The warming night time back radiation of greenhouse gases is supposed to make the minimum temperatures warm faster than maximums. The large white area on this map is therefore bad news for the fear industry despite all the free misleading advertising it gets from one hot day not being compared to six months of reality. www.bom.gov.au/web03/ncc/www/awap/temperature/mindecile/6month/colour/history/nat/2017040120170930.hres.gif
Siliggy it is a pity that BOM does not make measurements as they did in the 1860’s. Would be good to see data on sun’s radiation and atmospheric pressures. SOI is based on pressures. Surprised that ozone levels were measured at that time. Interesting to see data of deaths related to cold weather. There would not be many deaths in Tasmania due to hot weather other than those killed in bushfires which have occurred in cycles since the first humans there about 40,000 years ago. Note Tasmania was isolated from the mainland about 15000 years ago through rising sea levels. The Tasmanian aborigines were the last of the original inhabitants or first people of Australia not the ancestors of the present lot who arrived about 5000 to 6000 years ago via PNG.
The BoM time series charts have a diurnal range option but it only goes to 2014. Why not 2016 like max and min from whence diurnal range must be derived?
Upward longwave radiation is at a maximum when surface temps are at maximum, in the afternoon. The claim that GHGs causes night time temps to rise faster than daytime temps is a physical nonsense.
Besides Jonathan Lowe showed Australian night time temps aren’t rising. Rising minimum temps result from earlier minimum temps due to decreasing low level clouds and reduced low level aerosol and particulate pollution.
This 1997 paper by Easterling et al demonstrates how closing or reduction of the DTR (daily temperature range or Max minus min) is dominant globally. Data from oceanic areas excepted. I list my points where I find errors and shortcomings in the paper. A confounding issue is that increasing UHI also increases the closing of the DTR.
“Global Warming” is in fact at night and at high latitudes
and in winter.
The reason is sunlight is at a low angle of incidence for the longest period. Hence reduced clouds and pollutants have the largest warming effect at the surface. Resulting in earlier and higher minimums.
Minimum temperatures usually occur when solar radiation at the surface exceed outgoing LWR (with some lag for conduction to the air).
Perth show was affected by the late September rain which makes for two years in a row according to the Show boss.
Clouds over Perth Royal Show not enough to force change of dates, organisers say 10 Oct 2017
www.abc.net.au/news/2017-10-10/cloud-over-perth-royal-show-wont-force-date-change-organisers/9034126
Maybe move Show to Hills near dams.