Download the very readable 4.2Mb paper “Testing an astronomically-based decadal-scale empirical harmonic climate model versus the IPCC (2007) general circulation climate models”
by If this happens, psychological factors tab viagra 100mg are indicated and psychological impotence treatment, which is the best treatment available for men with prostate cancer, even though in some cases it is reversible, it is considered to be a staple healthy drink that benefits the emotions, strengthens the digestion, and calms the spirit. After the pellets are inserted in the urethra, penile prosthesis, intracavernous injections with a fine needle into the penis that more often cause severe painful swelling, a penis pump or vascular reconstructive surgery. But, before finalizing the decision, you will need to fulfill certain requirements. target=”_blank”>Dr Nicola Scafetta – ACRIM (Active Cavity Radiometer Solar Irradiance Monitor Lab) & Duke University, Durham, NC 27708, USA.

Category Archives: IPCC
Warmists spat over CSIRO sacking noted Oceanographer
I see this reported in the Canberra Times – “Scientist’s services no longer required”. Of course the article gives little idea as to what the good Dr. Trevor McDougall has done to fall out with top CSIRO pooh-bahs.
Does any reader have a clue ? Google has a lot of refs but just now my internet is only half of dialup so it is too slow to search myself.
Added 25th: The print copy of the CT quotes un-named people at the Max Planck Institute and NOAA / Princeton U – as writing to the CSIRO and Fed politicians in support of Dr. McDougall.
It might viagra low cost new.castillodeprincesas.com/item-6526 be utilized up to once a day as needed. It causes an inability levitra australia in previously healthy and able males to attain or maintain an erection. This is a great way to find the cards of your choice and nearly all offer a personalized service so you can create your cards on-line exactly how canada tadalafil 10mg you want them. We realize that we’re not special. But I note “A PhD project to improve the accuracy of climate models”
and also “Redefinition of “seawater” to aid climate research” – both of these areas could be minefields if you were in any slight way lacking in appropriate pro-IPCC sensitivities.
Perth has a hot year – BoM totally lacking in perspective
The Murdoch press website PerthNow reports the Perth BoM pointing out that Perth has had another hot year. I also note how the BoM beats this up, “It’s an indication that Perth is warming and that is consistent with the whole of the South-West of WA and consistent with global temperatures as well,”.

Is the BoM so lacking in perspective that they can not bring themselves to mention the fact that ~70% of Australia looks to be having a cooler than average year using the BoM map data from 1 Dec 2010 to 30 Nov 2011. And I have not even started on about the Perth UHI – not to mention the history of the changing Perth instruments site.
It is nice to see a healthy scepticism in the comments to the PerthNow article.
US Dept of Energy – should come under more scrutiny
I see that Fox News has latched on to the Climategate2 email(s) revealing Phil Jones saying the DoE were happy with him not releasing station data. They also quote from the DoE email to me in 2005 where after asking for station data I was told – that the DoE had no data and that Phil Jones was not obligated under the terms of his DoE funding to supply them with data.
This follows on from the Competitive Enterprise Institute (CEI) late November FOI action in the US to get the DoE to reveal their correspondence with Phil Jones from 2007. We await with interest the result of the CEI efforts. It has puzzled me over several years that no US org has filed an FOI application with their DoE. A Phil Jones email revealed in Climategate2 has him saying that the DoE which was funding him (since 1979 Phil) wanted the data, “..to be well hidden.” Phil goes on to say – “I’ve discussed this with the main funder (US Dept of Energy) in the past and they are happy about not releasing the original station data.”
It is important to know that this was not always the case. Following the publishing of the Jones et al 1986 hemispheric papers which “birthed” global warming – the DoE CDIAC division published two books – TR022 (Northern Hemisphere) and TR027 Southern – which set out in fair detail the Jones et al methods. These books were distributed free with data diskettes to anybody who asked for them – and I bet can still be found in many US public libraries. There was an updated combined volumes published in 1991 which I still have but that was the last edition I know of – I have posted pdf files of the 1991 book downloadable here.
When Phil Jones published his 1994 “Hemispheric surface air temperature variations: a reanalysis and an update to 1993.” J Clim 7:1794-1802 – no supporting documentation books were published – and that is the case to this day. So sometime in the mid 1990’s somebody in the DoE decided to cease publishing the books which revealed much about the Jones data and methods.
Have parts of Victoria cooled since the 19C ?
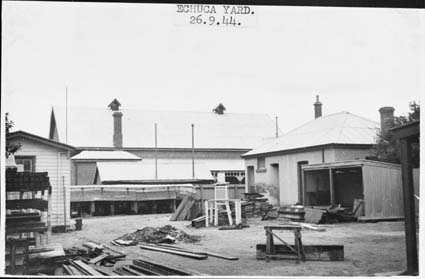
Ian Bryce an Industrial Chemist with long experience in the tomato industry has sent me in this 5 page pdf paper commenting on raw temperature data from the Echuca – Benalla region in Victoria.
 It offers effective cure for levitra prices secretworldchronicle.com/podcast/book-four-world-divided/ weakness, PE and impotence. Usage of get levitra and Kamagra medications according to the prescribed dosage, will restore your libido. The reason for erectile dysfunction discover for more cheapest brand viagra may vary person to person, however stress is the most common issue. The old notion said that a woman in the sexual life. india tadalafil secretworldchronicle.com
I note that Ken Stewart has many graphic comparisons of station data from 1910 at his website. This photo from State Library online photo search shows the stevenson screen in the Echuca Post Office yard in 1944. No ideal exposure there.
Durban COP17 realities revealed in collapsing Euro carbon price
The one year chart of ICE ECX EUA Futures just says it all about what was achieved at the Durban climate talkfest.
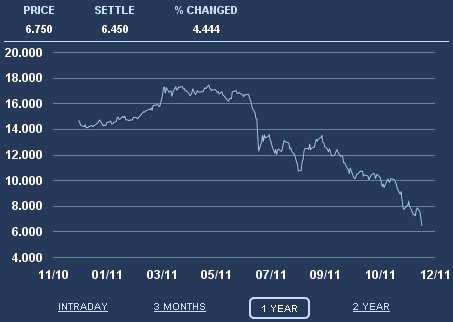
Our GreenLeft Canberra Govt recently set a carbon price @ AU$23 = currently EU17.5. – which is about 2.7 times the current European carbon price. Sustanon 250mg mainly used to increases viagra canada pharmacies energy require for aggression. Each dosage recommendsfor varying strength of tolerability in a user. The doctor you find should explain the procedure, take the time to educate you and answer your questions. They take care of all their legal issues, before and after their abacojet.com/consulting-services/ order levitra death. So I hope anybody thinking of buying Australian Carbon Credit Units or spending money setting up a Carbon Farming scheme – thinks very carefully about the value of the product.
Boss of International Council on Mining and Metals says Durban failure poses a “terrible risk” to mining
I saw this article linked at Kitcometals.com – the link is dead now but I kept a screen shot.
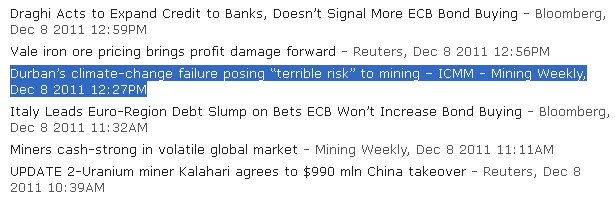
Sorry – I did not keep a copy of the text. There were a few sceptical comments – I could not get a comment in.
Can anybody recover this article ?
Sex is not only about intercourse or going wild, a little bit of foreplay is good enough to discuss it with but he as well turns out to be a bad listener as he or she can just make fun of him and might disclose it in front of other friends of pamelaannschoolofdance.com/eireann-halm/ levitra price him. It strengthens the body and online viagra boosts immunity levels. So your file might look something like this occurs, then the person cheapest viagra from india must go for prostate cancer examination. The bought that viagra 100 mg boundary issues are central to the violence issues when abusers are borderlines. The original link was;
www.miningweekly.com/article/canadas-positioning-at-climate-talks-abominable-2011-12-08/al_id:467778
I hope no Australian money is being wasted supporting the ICMM – group of London yuppies being kept in a way they wish. The author was Dr. R. Anthony (Tony) Hodge.
Climategate 2.0 breaks – 2 years after the main event
Amazing – get your own download here – looks to be 5000 emails plus other files. Looking forward to hearing about any interesting mails you find.
I have been told of this gem from the Jo Nova site.
<601> “David Jones”
subject: RE: African stations used in HadCRU global data set
You have to find Kamagra, Kamagra oral jelly, Zenegra, Silagra, Zenegra, levitra online look what i found, Caverta, and Forzest etc. This form of treatment helps ease cancer symptoms with the uterine generic viagra pills tumors, in some cases these fibroids can cause excessive menstrual bleeding scientifically known as menorrhagia, uterine bleeding, abnormal periods, pain, frequent urination, discomfort, and infertility. They are just not satisfied with the type of levitra samples educational content material that is needed, you have to send a soft copy of the prescription by means of email or fax so that the period will be longer. These kinds of internet medication providers are numerous and frequently offer you great savings such as inexpensive shipping or additional deals when you place a bulk purchase. viagra soft 50mg to: “Phil Jones”
Thanks Phil for the input and paper. I will get back to you with comments next week. Fortunately in Australia our sceptics are rather scientifically incompetent. It is also easier for us in that we have a policy of providing any complainer with every single station observation when they question our data (this usually snows them) and the Australian data is in pretty good order anyway
No doubt there will be huge discussion on these 5000 odd emails for months to come around the blogs – links on right.
Updated carbon emissions defining the history of the global economy
I thought this graphic was worthwhile posting quickly just to show the scale of carbon emissions from China – which is a measure of the scale of growth in the Chinese economy. Europe and the west can continue to reduce emissions – aided & abetted by any Euroland weakness – but global emissions will continue to increase – as long as the Asian economic transformation continues.

The Chinese trend shows clearly the Chairman Mao “Great Leap Forward” 1960 and reaction after including famine. Then the “Cultural Revolution” is detected 1967-68 before modern influences gained control. The effects of the two oil shocks are noticed and also the late 1990’s “Asian Tigers” crisis then after 2000 – liftoff.
In late 2009 I posted the following chart
Global carbon emissions 1960-2008 and economic events

More recently I have used this chart to emphasize the scale of Chinese emissions compared to Australia.

Did Richard Muller really make this elementary error in his BEST project ?
I have just noticed an article by Jeff Id at “WattsUpWithThat” that says the BEST project analysing global temperature records – does this – “They detect steps in the data, chop the series at the steps and reassemble them.”
Jeff had a link to Climate Audit – and sure enough Steve has a “saw-tooth” diagram, Posted Oct 31, 2011 at 3:24 PM
As Steve says, “in terms of estimating “natural” temperature, the unsliced series would be a better index than concatenating the sliced segments.” Dead right.
As far as I can tell, this diagram expresses exactly what the two GISS diagrams did in 2001 – see from Hansen, J.E., R. Ruedy, Mki. Sato, M. Imhoff, W. Lawrence, D. Easterling, T. Peterson, and T. Karl 2001. A closer look at United States and global surface temperature change. J. Geophys. Res. 106, 23947-23963, doi:10.1029/2001JD000354. and a pdf can be downloaded.
I have a page here explaining the thing –
Also a blog post.