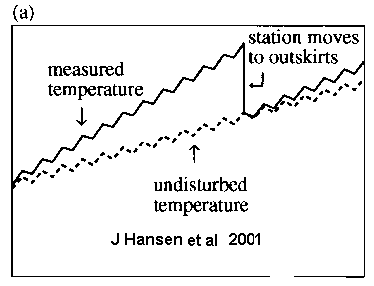
Thousands of temperature records globally have been perturbed as illustrated in (a) .
Jones et al 1986 document many "corrections" to steps and jumps in data, see my 20th Anniversary Review and the page on the 1988 Wood Comment
Jones et al however NEVER document "corrections" that would leave the data close to the "undisturbed temperature" in these figures.
I am not aware that any of the major groups compiling global trends have produced final gridded data reflecting the "undisturbed temperature" as shown on these figures.
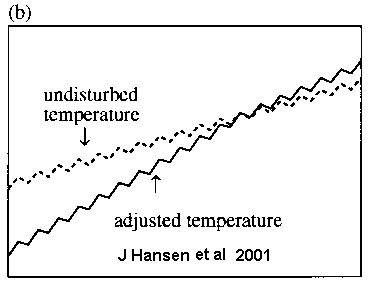
In discussion top right column page 23,953 Hansen et al say "In this case, if the record is adjusted for the discontinuity (Figure 1 b), the adjusted long term temperature trend is less realistic than the trend of the unadjusted data ..." In other words, making an adjustment as in Fig 1(b) leaves MORE artificial UHI warming in the data compared to leaving the step in the data as in Fig 1 (a).
In the case of Jones et al 1986, we must understand that "step" corrections, either up or down are simply THE ONLY corrections they ever did. These would have become progressively more invalid as time has passed since 1986.. Note my pages on Sydney showing how by merging the old Observatory site with the airport, the resulting step partially offset a century of UHI growth but by 2000, the airport had caught up with the city centre.
Probably it is these facts that are behind claims by the IPCC that their claimed very small (~0.05 deg per century) UHI component in Jones et al global trends might be increasing.
Too little and too late IPCC.