Minus 7.2 is the coldest daily min for June at Canberra Airport since 1986
I have not found that the ABC www has reported this.
It flies in the face of what BoM said on 1st June.
The Bureau forecasts warmer and drier winter conditions for much of Australia 01/06/2023
media.bom.gov.au/releases/1169/the-bureau-forecasts-warmer-and-drier-winter-conditions-for-much-of-australia/
I notice Weatherzone skillfully confuses the issue with any month.
Ben Domensino, 21 June 2023, – Coldest morning in 5 years for parts of NSW, QLD, ACT
www.weatherzone.com.au/news/coldest-morning-in-5-years-for-parts-of-nsw-qld-act/1342232
The minus 7.2 flies in the face of the ever increasing Canberra urban heat island – just checkout recent developments near Canberra Airport.
Does not exactly back the warming meme that demands we commit to NetZero by whenever.
UKMO BoM Weather Observation Website going nowhere
Summary of UKMO BoM WOW pages
bom-wow.metoffice.gov.uk/
they say “Welcome to the Bureau of Meteorology Weather Observation Website The Bureau of Meteorology has collaborated with the UK Met Office so Australians may easily lodge and share weather observations, information and photos. Find out more about WOW and read the Bureau’s Disclaimer. For official Australian data, forecasts and warnings, go to www.bom.gov.au.”
There is a Blog or as they say a Forum.
groups.google.com/g/met-office-wow
And we find the first posts to the Forum were ~Aug 2013 and there were 111 posts and last post was in Oct 2018. So the public seems to have given up on WOW. I think it is clear from the URL that WOW was originally a UKMO idea – I guess BoM jumped on board and apart from the map of real time temperatures it all looks a bit like an unloved project now. Remember Climategate started in Nov 2009 so WOW was initiated by UKMO not long after dust was settling from Climategate which was a disaster for many many IPCC compliant National Met Office Orgs like UKMO and BoM.
A personal note here – WOW went under my radar till I heard about it in the last week or so on a sceptics email forum.
Perth exceeds June rain in first 10 days
Checkout totals against AWN “Normal” here
www.australianweathernews.com/data/DS1_09.HTM
As I write totals are only to the 9th and there may be a few more mm to add for the 10th.
More later
AWN Oz page www.australianweathernews.com/recent_AWN_daydataCurrentMonth_station.html
Back in March I blogged
SW WA rainfall the arm-waving Gov misinformation continues as BoM closes or neglects rainfall stations
www.warwickhughes.com/blog/?p=7120
Several subjects to be covered/touched on/updated in this important contested area flooded with Gov funded misinformation.
I listed issues A to H all very much alive.
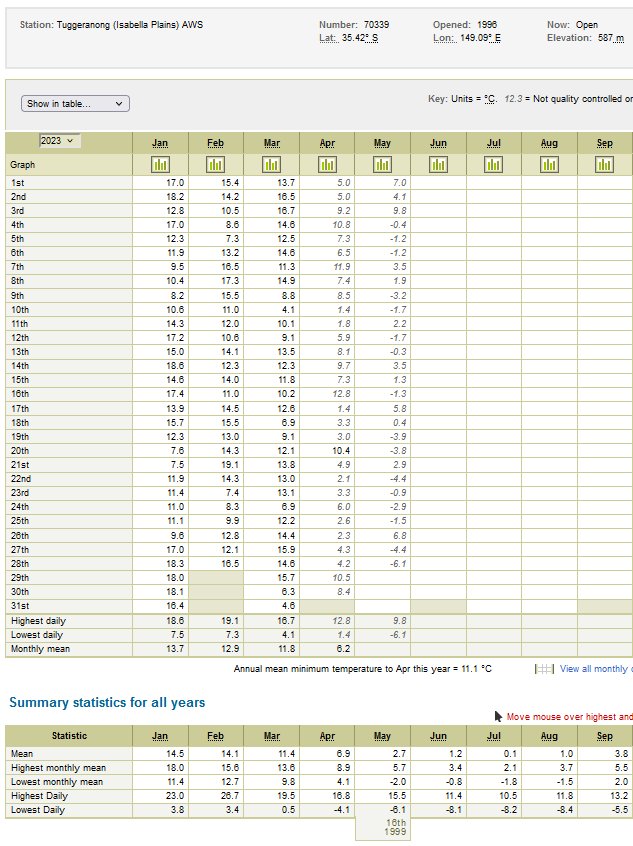
Canberra equal record cold morning from 24 years ago
Tuggeranong (Isabella Plains) AWS Number: 70339 just recorded minus 6.1 degrees equal to 18th May 1999.
And against the growing Canberra urban heat island UHI.
I aim to post a screen save overnight if my %@@#%ing software will do the upload. www.bom.gov.au/jsp/ncc/cdio/weatherData/av?p_nccObsCode=123&p_display_type=dailyDataFile&p_startYear=&p_c=&p_stn_num=70339
Some main stream media commentary from Weatherzone.
Corine Brown, Today, 4:03 AM AEST
Nation shivers through coldest May morning in decades
www.weatherzone.com.au/news/nation-shivers-through-coldest-may-morning-in-decades/1295094
Six ALDI red or white to anybody spotting the MSM mentioning UHI in these circumstances.
Here is link to my screensave of – Tuggeranong (Isabella Plains) AWS Number: 70339 just recorded minus 6.1 degrees equal to 18th May 1999.
www.warwickhughes.com/agri16/Tugg-equal-record-cold28May23.jpg
The Stone Age a taboo subject re The Voice
It is fascinating in the context of publicity and propaganda here by the GreenLeft/Albo/Govt around The Voice that nobody mentions(not that I have seen) that the arrival of the British First Fleet here in Jan 1788 tolled the bell for the end of The Stone Age lingering on across the wide brown great southern land and named New South Wales by the new settlers, now known as Australia.
The Stone Age and associated violence, horrors and hardships across the wide brown great southern land ended the day the British First Fleet landed here and started establishing a new society. Indigenous people could look forward to an improving standard of living and increased life expectancy as they participated in the development of the NSW Colony. The huge and globally historic improvements in living standards and life expectancy that emerged from the industrial revolution in Britain inevitably flowed through to the Colony of NSW.
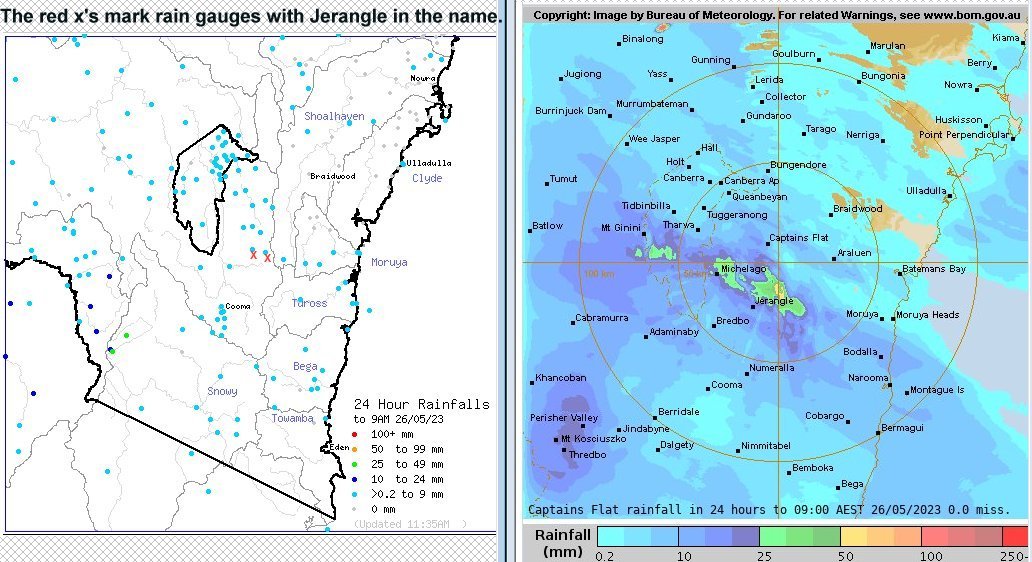
BoM Canberra radar still inaccurate after big overhaul
BoM announced recently that their Canberra(Captains Flat) radar was offline –
Quote[This radar is undergoing routine maintenance and will be offline from
15/05/2023 to 24/05/2023 – Reason: Technical or equipment problems Date: 15/05/2023
Start time: 7:30 am EST Duration: 226 hour(s) Estimated time of restoration of service: 24/5/2023 5:30 pm EST]
Now the Canberra(Captains Flat) radar is back on duty but I see huge errors for the 24hrs to 9am 26May.
My twin screensaves comparing – BoM radar estimated rain vs BoM and NSW Gov rain gauge rain show the main belt of “dogsballs errors” around Jerangle. www.warwickhughes.com/agri16/Jerangle-radar-rain-errors26may23.jpg
On the rain gauge map I have marked with 2 red X’s the stations with Jerangle in the name – not the slightest sign of rain in gauges anywhere near 25mm
Big Autumn cooling hits Sydney says Weatherzone
Weatherzone has a good story in their News section headlined “Sydney struck by big autumn cooling 13May23”
www.weatherzone.com.au/news/sydney-struck-by-big-autumn-cooling/1268201
Thats Sydney Australia downunder.
But of course as usual Weatherzone never fail to ignore saying this cooling is in the face of the largest urban heat island (UHI) on Wide Brown Land.
Note too Chris Gillham’s charts showing the cool Australian summer is carrying on.
Despite BoM’s frantic media about “Heatwaves”.
www.waclimate.net/australia-cooling.html
SW WA rainfall the arm-waving Gov misinformation continues as BoM closes or neglects rainfall stations
Several subjects to be covered/touched on/updated in this important contested area flooded with Gov funded misinformation.
A – The usually reliable Dwellingup 9538 failed to record rain on 31March when radar shows ~50mm fell.
www.bom.gov.au/products/IDW60801/IDW60801.94620.shtml
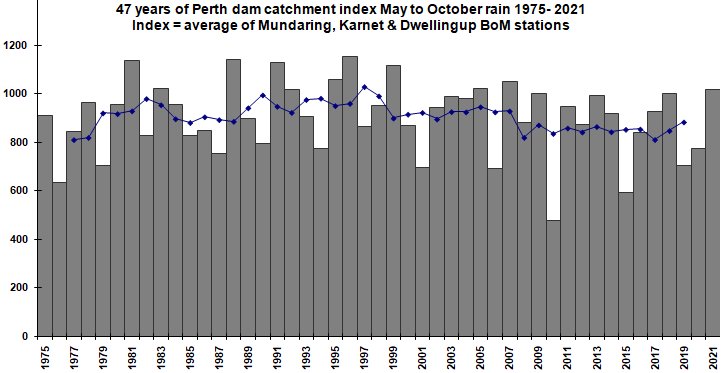
Long term readers here should know that over a decade ago I constructed my “Perth Dams Catchments May-Oct Rainfall Index” series from three stations – Mundaring Weir 9031, Karnet 9011 and Dwellingup 9538. In recent years BoM has discontinued Mundaring Weir 9031(see C below) so I have replaced that with Mundaring 9030. I have been well aware that Karnet 9111 has been getting worse and may have to look for an alternative site (see B below). My last update of my “Perth Dams Catchments May-Oct Rainfall Index” series is to year 2021 and I still have to do the work to update 2022.
2021 update 47 years Perth dams catchment May-Oct rain index 4Aug2022
www.warwickhughes.com/blog/?p=6960
Here is best link to my full 2021 chart.
www.warwickhughes.com/agri16/per-dams-catch-index2021.jpg
B – The patchy and unreliable Karnet 9111 turned in an obviously gappy & incomplete 2022 total. Seemingly accepted by BoM.
www.bom.gov.au/jsp/ncc/cdio/weatherData/av?p_nccObsCode=136&p_display_type=dailyDataFile&p_startYear=2022&p_c=-16612931&p_stn_num=9111
Why Karnet 9111 should be so unreliable I fail to understand as it is near a State run prison where there would be no shortage of labour to reliably curate rainfall gear.
I might have to include the well curated Bickley 9240 into my “Perth Dams Catchments May-Oct Rainfall Index” series to replace Karnet.
C – BoM has killed off in recent years several unreliable rain stations down the line of Perth dams – see previous blog
BoM chooses not to explain Perth dams faulty rainfall data 23Jul2018
www.warwickhughes.com/blog/?p=5871
D – All the above & below subjects mesh with my Muja blog where I expose the “barking mad” claim by ABC/BoM/ANU Academic that Muja Power Station 9738 rainfall was really as low as 124/127mm for calendar 2022.
ABC sucked in by obvious rainfall errors at Muja Power Station a BoM site 1Jan2023
www.warwickhughes.com/blog/?p=7061
E – The ever GreenLeft Our/ABC after Christmas 2021 published this arm-waving twaddle –
Why WA’s south-west is drying out at one of the worst rates in the world 28Dec21
www.abc.net.au/news/2021-12-28/why-south-west-wa-is-drying-out/100625142
And for your interest while on the subject of “arm-waving twaddle” – I see these glossed-up wild claims.
Guided by nature – Indigenous Australians use their deep spiritual connection to the land to track the seasons, but elders are warning of a “massive shift” in climate. 31Mar23
www.abc.net.au/news/2023-03-31/indigenous-australian-seasons-guided-by-nature/100919396
F – I have various blogs and www pages over more than a decade exposing the WA Gov and Water Corporation dodgy claims that rainfall decline has caused streamflow into dam catchments decline. In fact decades of neglect of scientific “control or thinning of excessive catchment bush” is the main cause of any runoff decline.
No water shortage forced seawater desal on Perth 27Feb2018
www.warwickhughes.com/blog/?p=5608
see link to – There never was a rain shortage to justify seawater desalination for Perth’s water supply 4Dec2007
www.warwickhughes.com/blog/?p=145
BoM March23 rain Outlook many fails
BoM rain Outlook for March
www.bom.gov.au/climate/ahead/outlooks/archive/20230223-outlook.shtml
Note dry NSW mid-west – wet NSW coast – note the dry near Mt Isa and belt east of Longreach – note dry Wagin-Perth – wet Hobart
Now lets check reality – Australian rain percentages for the month to date
www.bom.gov.au/climate/maps/rainfall/?variable=rainfall&map=percent&period=cmonth®ion=nat&year=2023&month=03&day=28
You can home in on States for greater detail.
To try and put the best spin on their many Outlook fails they helped the GreenLeftABC with this cluster-of-excuses.
Rain douses dry predictions for autumn with storm spell predicted to peak this week 29Mar23
www.abc.net.au/news/2023-03-29/autumn-weather-australia-storm-spell/102155924
Dirty drinking water in Narrandera??? an iconic NSW Govt monster fail
With a NSW State election due in 2 days this ABC story highlights a long term failure – the magnitude of which is difficult to convey without Shakespearian word skills.
Plus a State Govt now anti-dam. Only One Nation would be reliably in favour of building dams.
‘Dirty’ tap water in Narrandera is causing diarrhoea and rashes, residents say 23Mar23
www.abc.net.au/news/2023-03-23/narrandera-water-dirty-complaints-sick-residents/102129344
Will add more here later but check my “Water” category on the left.