Our GreenLeft ALP/ABC has an interesting article on Australian rainfall during our often wet 2022.
Raining champs – Records fell up and down Australia’s east coast as rains, floods and insurance payouts all hit new peaks. As we welcome back the sun to our lives in 2023, what should we do to prepare for the next big wet? – Casey Briggs 31Dec22 – www.abc.net.au/news/2022-12-31/australian-weather-rain-2022-records-broken-flooding/101789262
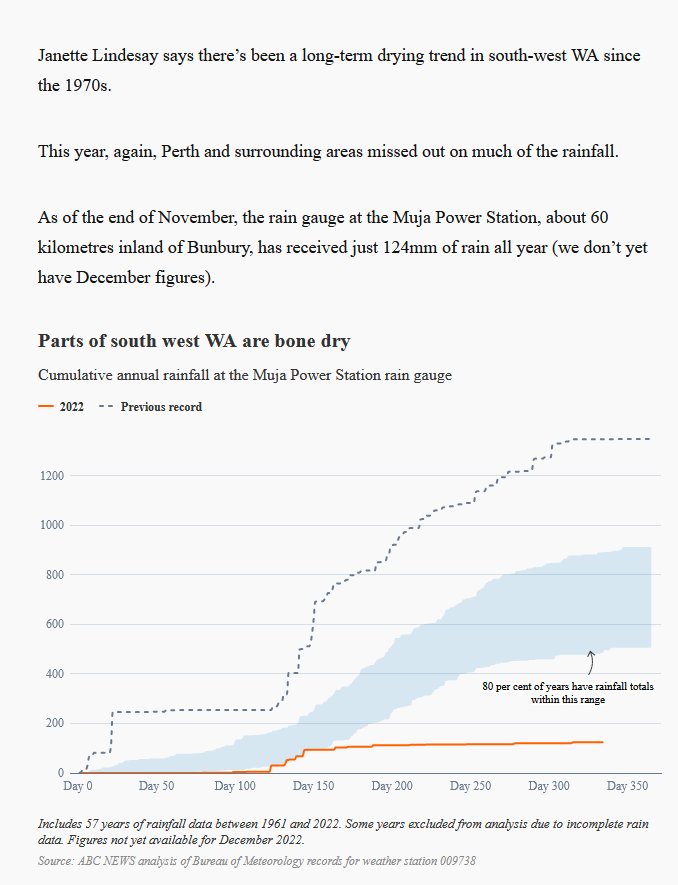
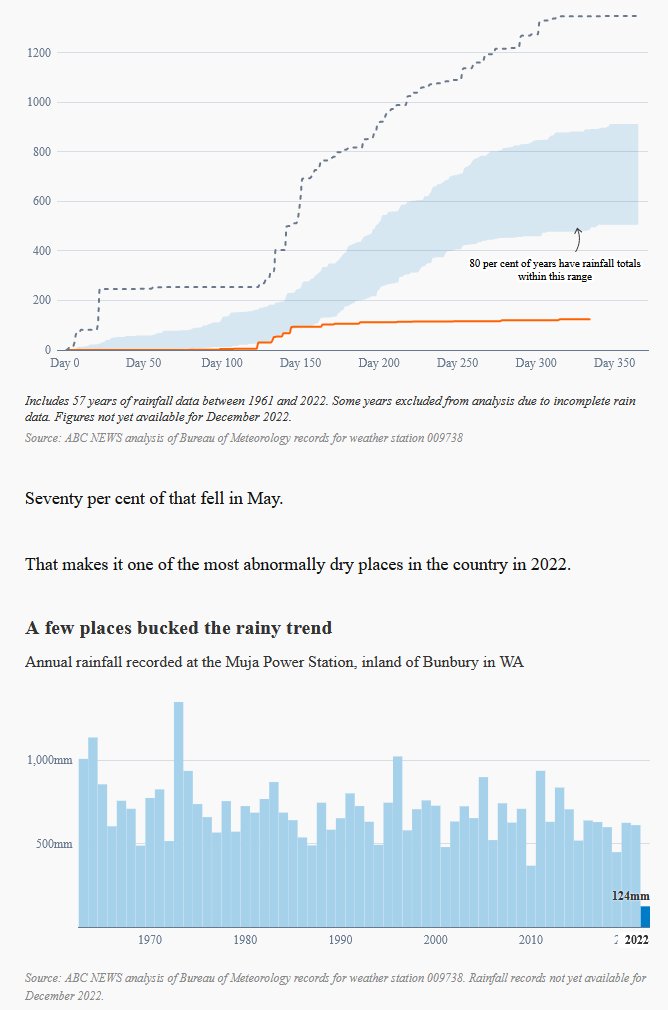
There are plenty of interesting graphics and photos to help us reprise 2022. Here and there through the article there are quotes from Professor Janette Lindesay, a climatologist at the Australian National University. About 2/3rds down their page we come to a map in shades of greens a greys preceded by text saying – “This map shows you how much wetter 2022 has been. We’ve taken data from nearly 1,000 weather stations, to map out how different this year’s rain is from the median of the past 30 years.” You see parts of SW WA are in a grey zone which means [10% dryer than …the median of the past 30 years”. Reading down under our grey and green map we see a quote by Professor Janette Lindesay “Janette Lindesay says there’s been a long-term drying trend in south-west WA since the 1970s.” Moving down the ABC says “This year, again, Perth and surrounding areas missed out on much of the rainfall.” Yet Perth Metro recorded 700.2mm in 2022 which is only 36.6mm under the annual mean. The ABC goes on “As of the end of November, the rain gauge at the Muja Power Station, about 60 kilometres inland of Bunbury, has received just 124mm of rain all year (we don’t yet have December figures).” Beneath that are two charts headed by “Parts of south west WA are bone dry – Cumulative annual rainfall at the Muja Power Station rain gauge” This graphic
www.warwickhughes.com/agri16/ABC-Muja-rain31Dec22.jpg
and the chart underneath shows how BoM rainfall data from Muja Power Station BoM #9738 has only recorded 124mm rain for 2022. www.warwickhughes.com/agri16/ABC-Muja-rainb31Dec22.jpg
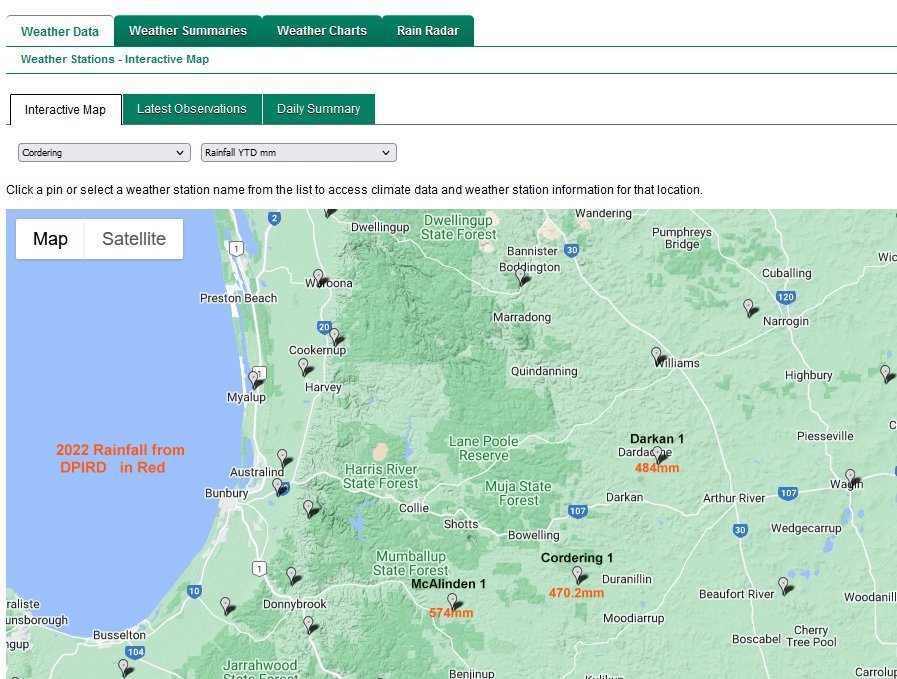
I have checked rainfall from surrounding BoM and WA DPIRD gauges and those data offer no support for the notion that Muja Power Station BoM #9738 can be relied upon. Here are links to two Collie/Muja district maps annotated with 2022 rainfall, one from BoM -https://www.warwickhughes.com/agri16/BoM-Muja-district-rain2022.jpg
and the other from WA DPIRD.- www.warwickhughes.com/agri16/DPIRD-map.jpg
Remember the WA DPIRD has a separate network of weather stations indie of BoM.
You can make various 2022 rain maps now at this BoM page –
www.bom.gov.au/climate/maps/rainfall/?variable=rainfall&map=totals&period=12month®ion=wa&year=2022&month=12&day=31
Below here hoping to show screen save of Muja Siteinfo pdf page 9 re rain gauge failing performance tests in 2011 – see comments below

The Serpentine rain radar can give a mapped record of estimated rainfall. If you were to watch the rainfall that is recorded by this alternate method of radar mapping and take screen shots, perhaps a provable fail can be screen captured. It seems to only display a rain record for the 128kM radius but that comes close to covering the area.
www.bom.gov.au/products/IDR70C.loop.shtml
This is similar to the Eugowra flood forecast fine tuning method i suggested at the link below. That is, watching the Yeoval radar short term record over the Nangar national park area during an unfolding Eugowra flood event.
www.warwickhughes.com/blog/?p=7037
Thanks Siliggy I will keep in mind your point about BoM Serpentine radar.
I past years I have used Oscilmet to recover archived radar info – often around bush fire issues.
www.oscilmet.com.au/
Just logged in and had a look – I can only see a way to recover 20 scans – nothing like going back a year.
Going to BoM Serpentine radar I can only see a way to add current weather obs, max t, min t & rain.
If there is a way for radar to estimate rainfall over longer periods – I am all ears.
Remember my 16Dec22 blog
NSW cold records tumbling in mild start Australian summer
www.warwickhughes.com/blog/?p=7044
Well the December mean t anomaly did end up overall cool for Oz. Make your own maps here.
www.bom.gov.au/jsp/awap/temp/index.jsp
And Sydney at Observatory Hill BoM never hit 32C all of 2022!!!!!!!!
As I write the 30 day SOI is ~+19 and rising!!! and the 90 day SOI is just above +14 and steadier. LaNina still rules.
No experts explain what has happened to Oz cyclones???
Am I imagining it or is the original “ABC sucked in…” article by
Casey Briggs 31Dec22 – no longer being flagged on their front page?
I have not been idle – and have been seeking other independent evidence of 2022 rain totals near Muja. Fingers crossed. When I lived in Perth it would have been easier.
“If there is a way for radar to estimate rainfall over longer periods – I am all ears.”
It only seems to record 24 hours.
When i suggested ” If you were to watch the rainfall that is recorded by this alternate method of radar mapping and take screen shots, perhaps a provable fail can be screen captured.” I mean a live event some day in the future, assuming it is still faulty.
Just checked the site info for this here.
www.bom.gov.au/clim_data/cdio/metadata/pdf/siteinfo/IDCJMD0040.009738.SiteInfo.pdf
It seems to be saying that the rain gauge was last replaced in 1997 although someone did a new drawing in 2011. It also appears to have failed a performance check in 2011.
The rain gauge is a Nylex 1000. “Available at Bunnings”?
www.nylex.com.au/product/rg1000-3/
I do wonder how often it is really replaced. Can it really be 25 years old? Does it leak?
Siliggy,
The Imperial rain gauge may have been replaced by a Metric rain gauge.
The Metric rain gauge has Stromberg Carlson carburetors and a Lukey muffler and goes much faster than the Imperial rain gauge.
I would be surprised if Professor Janet Lindesay did not include that information in her next expose.
Thanks for your note about the rain gauge failing a performance check in 2011 which I now see was a HUGE notation in their MetaData on page 9. It would be great to have BoM well quizzed at Senate Estimates over this and other rainfall/climate related issues. Check out my screen save of what BoM say in Muja Siteinfo at the end of main blog post above.
I am trying here to add 2 links to maps showing possible location of the Muja PS rain gauge.
First from Google maps – www.warwickhughes.com/agri16/muja-map-raingauge.jpg
Second from the Muja siteinfo 2011 map www.warwickhughes.com/agri16/muja-map-BoM-siteinfo.jpg
see if WordPress lets these URL’s save. If the URL’s do appear I suggest copy & paste to a new TAB.
Sorry that my annotation “Pylon” on the Google map is obscured a bit – but you can see the Pylon. And it is on both maps.
I have spoken by ph to farmers within a bow & arrow shot of Muja Power Station and they measured over 500mm in 2022.
Your analyses are well appreciated, Warwick. And as you know, Muja is of interest for other reasons as well.
>” It would be great to have BoM well quizzed at Senate Estimates over this and other rainfall/climate related issues. ” [from your comment above]
Yes, it would.
Unhappily, Greg Hunt blocked Tony Abbott in Cabinet from doing this with any thoroughness. What hope Elbow/Bowen/Plibersek ? Of course, Senate Estimate hearings are not full-on inquiries, and the sitting Govt has sufficient powers to short-circuit the Senate Opposition questions – if the Opposition even wants to ask them.
It’s the narrative that counts. The vast majority of the country was is in a huge wet phase, but the ABC focus was on a small area that was marginally drier than average, with emphasis on a single weather station data set that best supported the narrative.
Hang on?
www.abc.net.au/news/2022-12-04/synergy-imported-coal-with-high-ash-content-from-nsw/101731306
“At the time, Premier Mark McGowan blamed a WETTISH WINTER and operating difficulties at one of the town’s two coal mines for the unprecedented decision, which Energy Minister Bill Johnston also said was “not ideal”.”
Thanks for that GREAT find baz – and from the ABC too – Too Good.
Apologies for being slow rescuing your comment out of the Mod list.
Anybody familiar with Perth water issues and rainfall and dams and desalination etc over decades knows how “de rigueur” it is in Perth for pollies and the “Great and the Good” of all stripes to maintain the mantra that “climate change took our rainfall” (in ~1975) – rainfall is to be mentioned in a dismissive or hand-waved away manner. So for Galaxy Lord Premier Mark McGowan to go against years of solid Perth tradition and refer to a “wettish winter” – must have indeed been through his gritted teeth.