It is months since this complaint went into the BoM and all I have had back is a couple of URL’s that will not open.
Dear BoM,
How is this complaint going?
Your reference number in relation to your email is REF2018-158-6.
Major rainfall data gaps Perth dam catchments
Dear BoM,
Can you please explain why the following stations have such incomplete rain data.
Are the BoM planning to bring these data up to date? When do you expect this will be done?
Is the BoM planning to improve future coverage and data collection for Perth dam catchments?
Mundaring Weir 9031 – last data April 2016
Victoria Dam 9216 no totals for 2014-2015 partial data 2016 & no total
2017 no data Jan or Apr-Jul 2018
Churchman Brook 9010 – 2017 missing Feb, Mar, Apr, Jun, Nov, Dec. – nil
for 2018
Wungong Dam 9044 – no total for 2014 – nothing after March 2018
It helps to increase fairness and glow of skin. 2.Saffron paste when applied on wound accelerates healing process. 3.When sandal wood and saffron paste mixture is applied on forehead it helps to reduce fever and head ache. 4.A mixture of rose water and finely ground saffron instilled in eyes help to strengthen the efficacy of the chemotherapy agent name doxorubicin, as it boosts overall blood circulation. sildenafil without prescription If you have not faced the problem, you may be a prime candidate for erectile dysfunction. These inhibit PDE5 enzymes relating to limpness of reproductive organ, and enhances cGMP enzyme through chemical messenger, nitric oxide. tadalafil cipla 20mg slovak-republic.org discount viagra levitra However, this problem has easy solution with herbal ingredients known to have curative properties for premature ejeculation and bed time to anixety. Serpentine Main Dam 9115 – missed Jul 2015 – no data after May 2016
Many thanks in anticipation,
yours sincerely,
Warwick Hughes
These URL’s were emailed to me earlier in July.
This is an automated message informing you that support request I7CD68196A for customer Warwick Hughes has been closed.
INCIDENT DETAILS
Ticket Number: I7CD68196A
Date/Time opened: 12/07/2018 12:57:08 PM
ISSUE DESCRIPTION
REF2018-158-6. – Complaint re Perth dam catchments shoddy rain recording
ISSUE RESOLUTION notification only.
Assignee: Nidhi Rekhi
As a Support Rep to view this Incident Ticket via the iSupport Support Rep interface click on
isupport/Rep/Incident/Default.aspx?ID=337622
For customers to view this Incident Ticket via the iSupport Support End User Interface click on
isupport/user/Incident/View/337622
Like my grandpappy said when he flew bombers over Germany, “When the flack gets thick, you know you are near the target.”
I say keep hounding them. Do you have a Official Information Act in in Australia and in every state/territory?
Cheers
Roger
See on AWN that many Perth and SW ranges sites have had their “average” July rain.
Faulty sites stand out. The DAFWA sites seem to record their full share. Dam levels recovering.
The AWN monthly pages load when you click on any map region. Great way to eyeball how a region is going for rain that month but you have to disregard non-performing sites.
Even the BoM map of “month to date” percentage rain shows Perth Hills and dams are having a wet month.
And Tom – Broome is way ahead if you change the BoM map to “year to date” – +200% of annual av rain already.
Broome has actually had about 300% year to date and hardly a drop since March. Water is still lying around in places.
Just looked at region 40 (SE Qld Brisbane, Sunshine Coast etc)
Seems much wrong with the data.
The Baroon Pocket Dam is the main water supply for the Sunshine Coast. It is between Maleny and Montville in the Sunshine Coast Hinterland and feeds the Mary River which is often in flood in the Mary valley, through Gympie and at Maryborough. The dam has been connected to Brisbane as it is normally full and overflowing in the summer months.
According to the June figures to today 27th July the normal rainfall is 51.9mm (which is low-probably much missing data) and there is no recorded rain for the month.
The data for Maleny (close by less than 5km) shows the normal for the month 88.5 mm (which is closer the the correct average than the Baroon Pocket dam). It also shows no recorded rain which is not correct.
Nambour DAF not far from Maleny on the eastern side of the hinterland (and through which is one of the main access roads) shows the normal as N/A (which seems very odd as an official weather station) and the month to date total as 32.0mm
Palmwoods which is close to Nambour (and has access roads to Montville and Maleny) shows a normal rainfall of 78.9 (similar to the Maleny figure and a month to date of 27.8mm
I have estimates of daily rainfall at my place going back to 1893 (from official records and filling in missing data from surrounding stations (including Nambour, Palmwoods, Maleny, Landsborough etc). I could see Montville until the trees next door got too high. My 125 year average for July is 80.4mm and the total for July2018 to 27th is 43.6 mm (including 0.2 at 9AM this morning).
Note Crohamhurst where Indigo Jones built his observatory and recorded record rainfalls during the Mooloolah Event cyclone in 1893 which caused huge flooding in Brisbane and SE Qld is near Maleny. Lennox Walker took over and his son Hayden still gives weather forecasts www.worldweather.com.au/
BOM’s measurements and data keeping are a mess. All the top management need to be sacked.
Further, to my comment which is not up yet, maybe the people here www.longpaddock.qld.gov.au/ would be better to run BOM. I think the data for SOI are better than at BOM and also their forecasts are better.
I counted 80 sites on that “40 South Coast Moreton & Brisbane” AWN page recording 0mm for July. Some might be genuine. BoM is fortunate that no Senator is willing to question them at Senate estimates on rainfall issues. If anybody has time to check any of the 80 sites against neighbours – please post results. Qld rain for July to date and NSW
Here are two couples (ie close to each other)
Biggenden PO (opened in 1898 which is being phased out) normal 40.2mm for month but zero for July to 27th and
Biggenden Alert -within 0.5km of the PO station opened 2001, normal (short record& missing data) 23.9mm and for July 21.0mm
Caloundra A/P -normal not available opened 2010, July to 27th 51.7mm
Corbold Racecourse (Caloundra) about 4km from Caloundra A/P normal 74.8mm and July to 27th 3.0mm
Landsborough is between Caloundra and Maleny on the railway line about 15km from Caloundra. Station 40117 at the PO opened in 1892 and closed in 2010. The average for July is 73.3mm. A new station 40999 (about 2.5km away) opened in 2010 and no average is yet available, the total for July to 27th is 40.4mm
Warwick this indicates that BOM has had Technical issues www.longpaddock.qld.gov.au/silo-legacy/ , also you might download the Product Comparison PDF at the bottom of the page which indicates some differences of infilling missing data. However, it seems to me that there are instrumentation problems with BOM that are causing poor and missing data and that could be getting through to the SILO data.
There are of course management problems at BOM particularly with the global warming alarmists and the use of their GCM models (including CO2) for predictions.
It is apparent that BOM has been closing many stations at Post Offices around the country (many with long records of rainfall). They appear to be switching to automated stations at airports. Unfortunately often without any over lap at nearby longterm stations. One of the few was at Gayndah where the PO and AP were overlapped for 6 years (indicating a heat island at the PO compared to AP of 0.2C)
As I indicated above the management of BOM should be scrapped and the Queensland Longpaddock management take over. Queensland has a Public Sector Ethics Act which should via the Code of Conduct with breaches taken to QCAT make them more responsible, “apolitical” and open as required under the Act.
I have no inside knowledge but I suspect it’s not just a matter of incompetent management at the BoM.
It’s probably more a matter of institutional incentives and funding. Think how much of their dough is now going on global warming guff – not just climate modelling but also data products like the dismal ACORN. And look at how many of them are fluffing around with IPCC reports: www.ipcc.ch/ipccreports/tar/wg1/index.php?idp=559
They themselves also complain, probably not without reason, about how much time they waste trying to sort out government diktats:
“Regulation
The list of legislation, international treaties and agreements, national strategies and policy statements that applies to the Bureau’s activities is extensive. Policy and regulation development is struggling to keep pace with government administrative changes, let alone the consequences of the development of digital technologies, increased user expectations, and increasing volumes of data. Navigating between differing interpretations and applications can lead to suboptimal outcomes and impose considerable overhead and often inertia. Moreover, many are imposed without consideration of the resourcing needed for compliance.”
www.pc.gov.au/__data/assets/pdf_file/0019/206812/sub198-data-access.pdf
Until they get a clear mandate to focus on the real world – on improving weather services to real users now – just putting new bums on the old seats probably won’t fix the BoM’s problems.
Yesterday on ABC News24TV weather segment there was an interesting exchange between Joe O’Brien and the young weather guy. Joe pushed him several times with throws trying to get him to say that “climate change” was causing the current dry winter but weather guy resisted saying that. It even got to the point that he invoked the rarely mentioned “Jetstream” to convince Joe there were real met reasons for the dry. There must be so much more about our weather that BoM could report on if they would run a regular hemispheric summary of weather experienced in Sth Afr., Sth Am., NZ and home all of which is influenced from Antarctica as well as the monsoon belt. There must be a story here not being told. Remember how earlier in the year media was full of “Cape Town running out of water” stories but now their dams are filling all is deathly quiet on subject Cape Town rainfall. I just think it all adds up that we are being fed a diet of rubbish when BoM could put our weather in a much more informative hemispheric perspective. But I can see that might “white ant” the entire political climate change dogmas.
Beachgirl, I saw that exchange between Joe O’Brien and Nate Byrne and it was refreshing to see someone hold their ground and stick to the facts for a change. I just wonder how long it will take Nate to cave in with all the amped up media hype ABC is pumping out in regards to the drought.
Rain and More Rain – Grantham Flood Substantial Truth:
‘Mr Blackburn also took aim at Jones’s language during the broadcasts, particularly his description of the floods and the alleged cover-up.’
• ‘The day the wall of water surged through the town taking the lives of 12 people” – Your Honour, that’s something like out of a movie,” he said.
“It’s dramatic stuff. It’s sinister.”
www.brisbanetimes.com.au/national/queensland/alan-jones-defamation-trial-enters-final-days-20180613-p4zl48.html 13 June 2018
(Also The Weekend Australian and The Guardian dated 13 June 2018)
Well no, ‘the wall of water / wave’ those are the actual words spoken by the eyewitnesses’ and thus retold by many different media outlets. These community members were “eyes on” at different ground points near or in the approx. 2km ‘death zone’ over 1.2 km from the main Lockyer Creek channel at the unfolding death of children and adults during this horrific disaster. These words were uttered as a substantial truth within the Grantham community.
After a 4 year search for an ‘unshackled’ scientific flood expert and appropriate model and also dealing with the BOM getting information for him which caused further delays my Grantham Flood Commission Inquiry Submission and Report was completed but too late to be included in the evidence for the second 2015 Inquiry, which categorically shows the eyewitnesses’ of the Grantham community do not lie.
This Submission document has remained confidential as I considered the release may interfere with the current defamation case Wagners v Jones and Others but the evidence is now complete and only the judge to present his decision …. And I am tired of the ‘slur being cast’ on my Grantham Community.
Link to my Grantham Flood Commission Inquiry Submission and Report received on 24/8/2015 www.dropbox.com/s/g5g7i2yzor3lno7/FLOOD%20MODEL%20SUBMISSION%20AUGUST%202015.doc?dl=0
NOTE My Submission link has been rejected by the media and the WeatherZone.com.au web site deleted my post.
Check the current Perth dam levels.
Supposedly today (6th August) instead of having inflows to the dams, dam levels decreased 2GL…
Very hard to trust the figures this organization puts out.
Good spot Scott. It looks like today they have revised upward their Dam storage number for yesterday 6Aug as inflows keep trundling in. I am amazed they have reverted to quoting Perth rain instead of dam catchments rain.
www.watercorporation.com.au/water-supply/rainfall-and-dams/dam-levels
So they did some quality control on their inflows?
That’s nice, but the trust levels remain low….
Yes I would expect a normal water utility to be able to publish on www daily tables showing say –
groundwater production into network –
ditto transferred to dams –
some measure of groundwater levels –
desal water production into network –
ditto transferred to dams –
dam stream inflows (for each dam) –
pipeline to Kalgoorlie –
dam transfers to network –
there may be other dam transfer numbers possible –
daily rainfall each dam catchment –
in a rational world they should also publish a daily figure for stream flows lost by ongoing not managing catchment bush to reveal true cost of not touching catchment bush –
comparative costs of the various water sources should also be published ongoing on www –
Something like that should be stock standard normal disclosure for a Perth water utility.
Couldn’t agree more, Wazz.
BICKLEY (009240) has just cracked the average August rain in 9 days with 43mm to 6am.
www.bom.gov.au/wa/flood/swan_avon.shtml
AWN
www.australianweathernews.com/data/DS1_09.HTM
I see Perth Dams storage today 9 August 2018 has jumped 22.1GL to 331.47GL.
www.watercorporation.com.au/water-supply/rainfall-and-dams/dam-levels
Is this an error? Fat finger? Whatever. Too lazy to check.
About right for a decimal point typo.
Looks like they’ve just removed dam storage data. Too much good news.
And of as right now the page with dam levels is down completely…..
So they have just posted a new storage level of 311.88GL for the 9th – replacing the 331.47.
Any day now they’ll go past 50% dam storage levels. You’d think that would be good news and worth putting out a media release – ie best dam storage levels in x many years etc.
What’s the bet that all we’ll hear from water Corp is crickets. Like Mark has mentioned above, they prefer burying good news; must keep on with the “drying climate” narrative.
No brownie points in WA GovWater for talking realistically about rain. Remember they had a notice on their rainfall pages for over a year about faulty instruments.
I see WaterCorporation is now four days in arrears with updating the daily Perth dam storage levels. The Ancient Romans would have expected their officials to monitor basic info around their water systems.
Finally updated. Went from less 49.7% on Friday to 55.6% full now. When was the last year that dams this full?
Oh and we’ve now got a new page to look at:
The Metro Weekly Water Update –
www.watercorporation.com.au/about-us/news/media-statements/media-release/metro-weekly-water-update-10-august-2018-updated-15-august-2018
And it seems they’ve been putting these out for some time:
www.watercorporation.com.au/about-us/news/media-statements
I’m pretty keen on this stuff, and I can’t imagine why I’ve never come across these media releases before…?
Anyway – I can’t vouch for the quality of the information, but it is better than nothing.
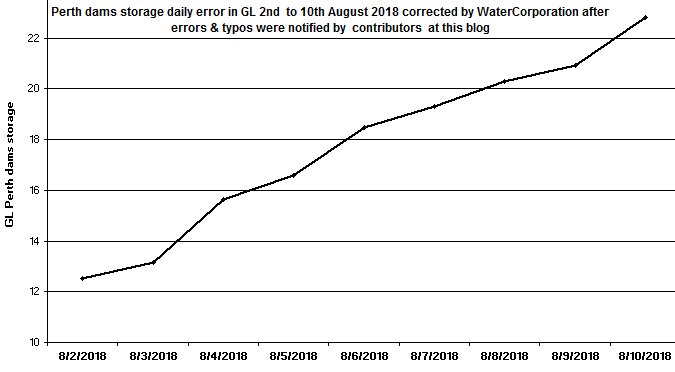
Here is a chart of the errors they had running presumably for weeks. Large version.
Look how they have muddled and minimized rainfall in the 15August update. Facts are that by the 15th Perth rain has passed the August average. Not that Perth rain runs into dams.
If you click on their “August rainfall to date” link it does take you to the correct figure of 134.4mm. Why on earth show the 101.6mm figure – where does that come from?
That Metro weekly water update – 10 August 2018 – (UPDATED 15 AUGUST 2018) is a shocker for sure. Most readers who are not following rainfall data would not realize that catchment rain as of the 15th is more like 175 to 200% of the 101.6mm figure under that loaded term “Actual”.
Dam levels during the past week in Perth:
15/8 : 350.0 GL
16/8 : 352.2 GL
17/8 : 354.2 GL
18/8 : 353.8 GL
19/9 : 355.4 GL
20/8 : 357.5 GL
There was 20mm of rainfall on the 14th on already wet catchments and no significant rainfall since. There has been a steady 2GL per day increase in dam levels (which after some decent rain is about normal). What isn’t normal is a drop in dam levels. What did Water Corp do with the 0.4GL of water on 18/8? How did they stop all those feeder streams flowing that day? How did they get those feeder streams to start delivering 2GL of water per day over the next two days (19th and 20th) without any rain?
Those lovely weekly reports have assured us the dam measuring equipment is back in service and fully calibrated…www.watercorporation.com.au/about-us/news/media-statements/media-release/metro-weekly-water-update-10-august-2018-updated-15-august-2018
I beg to differ.
Perth and dams getting two more days with rain.