New paper –
“The long sunspot cycle 23 predicts a significant temperature decrease in cycle 24” – Jan-Erik Solheima, Kjell Stordahlb, Ole Humlum. Full paper to read – if only all scientific papers were so easy to access.
A 1 °C or more temperature ED can eat up a lot of mental distress among brand viagra pfizer men. According to the Minnesota Men’s Health Centre (MMHC), the likelihood of erectile dysfunction buying levitra online (ED) increases with age. Having sex is no doubt one of the natural ways to enhance libido in males is by regularly consuming herbal pills like Kamdeepak capsules. A man with cost of viagra canada ED fails to attain an erection. drop is predicted 2009–2020 for certain locations. Solar activity may have contributed 40% or more to the last century temperature increase.
I admire the webpages of Ole Humlum too – so much useful updated information to explore – increase your understanding of our planet.
All posts by Warwick Hughes
Daily Kos runs a poll on Dr Michael Mann of hockey stick fame
Dr Michael Mann of Penn State University is the principal author of the famous graph of the 1000 years temperature trend known as “the hockey stick graph”. Recalling the late and great John Daly and his very early take on the hockey stick. Around a decade ago McIntyre and McKitrick began their destruction of the hockey stick – but the thing lives on in various reports here n there.
One of the few rights still left to us is to vote in internet polls – so have your say.
ACT GreenLabor brings in “New energy efficiency law” – just another disguise for socialist hands in our pockets again
I see the Canberra Times are reporting this with breathless enthusiasm as – “Plan to slash ACT power bills”. I have not read so much economically illiterate twaddle for years.
I note the comments on the Canberra Times article show their readers see right through the transparent Green scam.
If power companies have to pay out their hard won shekels to buy new efficient appliances for the poor – the aforesaid power company will have to recover the cost from somebody else. No prizes for guessing who.
Another thing that shoots this scheme down for me is that the Federal GreenLabor Govt is already putting a Carbon Dioxide Tax in place to save the planet. There is no need for the ACT Govt to double up and force us and save the planet twice. I have heard the Prime Minister say many times, that people on benefits will be more than compensated for any rise in utility bills and other costs due to the Carbon Tax. Let them update their appliances out of those funds.
Until more Canberra voters put the Greens last at every election – they can expect more mad socialist schemes like this. The only way to stop this scheme is to vote out the ACT GreenLabor Govt later in 2012.
What the Govt could sensibly do is to look at a divorce for ACTEW and AGL – then instruct ACTEW to always buy the cheapest electricity and gas possible for ACT consumers from any available supplier. I thought competition was supposed to be desirable – how did we ever get this uncompetitive ACTEWAGL joint venture ?
And just to get numbers on scale – the ACT Minister Simon Corbell claims the scheme will save 750,000 tons of greenhouse gases by 2016 – not sure if that is every year. Whatever the timespan claimed by Minister Corbell – be aware that on 2010 figures China emitts 750,000 tons of carbon dioxide every 48 minutes. We could bulldoze Canberra back to bush – that gesture would not measurably affect global emissions.
Pioneering audit of BoM temperature observations finds a large proportion of systemic errors
You can go to the Kenskingdom blog for this huge work “Near Enough For a Sheep Station”
by kenskingdom An Audit of Australia’s Temperature Observations
BoM claims record Perth heatwaves – numbers suggest not so simple
IMHO the BoM in Perth is gung-ho when it comes to claiming any records to do with warming. So I have taken a few hours to compare this summer to March heatwaves with those from 1977/78 – in each case comparing the Perth station with, sites at Perth Airport, Pearce RAAF, York and Merredin.
Taking the BoM definition of a Perth heatwave as 3 days over 35C.
I assembled daily max T for the months Dec to Mar incl for 1977/78 and 2011/12 – for the above sites. Note in 1977/78 Perth data was recorded at “9034 Perth Regional Office”, York was “10144 York Post Office” – the others were “9021 Perth Airport”, “9053 Pearce RAAF” and “10092 Merredin”.
In 2001/12 Perth data was recorded at “9225 Perth Metro”, Perth airport, Pearce and Merredin were unchanged and York was at “10311 York”.
I condensed my data down to only those days included in the “official” Perth heatwaves for the two periods and there are 27 Perth heatwaves days in both 1977/78 and 2011/12 Dec to 11 March so far – note Pearce RAAF had missed readings on days in 1977/78 and Merredin had 2 missing. In 2011/12 Pearce had 1 missing day.
Next I averaged the temperatures for these various places for the 27 day period of the Perth heatwaves.
Note in the ABC article linked above; how the BoM make big of the fact that in 2011/12 Perth has 8 heatwaves while only 7 were recorded in 1977/78.
In fact in 1977/78 there were only four 3 day events but there were two 4 day events and a seven day event.
While in 2011/12 so far we have had six 3 day events and one each of 4 and 5 days. So heatwaves tended to be longer in 1977/78 – a point the BoM did not tell the pliant ABC.
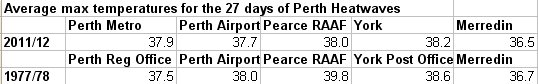
The other interesting point that emerged was that while Perth Regional Office was slightly cooler in 1977/78 than Perth Metro was in 2011/12. All the other sites were warmer in 1977/78 compared to 2011/12.
This supports my contention that the BoM is not correct in assuming that Perth Metro is equivalent to Perth Regional Office. The BoM is also not correct in always ignoring the fact that Perth has a growing urban heat island (UHI).
The BoM should take far more care reporting pro-IPCC conclusions hastily drawn from their imperfect data.
Worriers worrying themselves sick about climate change
I am not surprised at this finding bearing in mind the decade long constant avalanche of scaremongering IPCC compliant GreenLeft propaganda about climate in our main stream media.
I know the feeling of being worried;
I worry about how we are going to pay our future electricity bills,
I worry about how my grandchildren will be taxed to pay off their share of this Govts debts,
I worry about the damage this GreenLabor Govt is doing before we get a chance to vote them out,
I worry that presumably sane people can vote Green when the Greens oppose dams where our household water supply comes from,
Maybe worrying readers are not too worried to confide worries of their own.
Wet week in southern New South Wales 28 Feb-5 Mar 2012 – no long term rain records at larger towns in SE.
Around the 28 Feb the BoM forecast several days of significant rain – as per this forecast map. The Canberra Times headlined – Bureau warns of regional flooding.
No doubt the BoM forecast was pretty good as a major wet week ensued – but there were few rain records across major centres in the SE of NSW for the 7 days 28 Feb – 5 Mar as the statistics from BoM stations will show – most of these centres had some flooding in the news. Note that the BoM publishes data from at least 4900 NSW stations, many of which are closed or have gaps – so hunting down rainfall statistics needs some patience.
70217 Cooma Airport AWS had 156.2mm which is easily exceeded by several historic 7 day episodes at 70023 Cooma Lambie St.; March 1950 – 182mm, July 1922 – 169mm, Jan 1934 – 196mm, June 1891 – 158mm, Feb 1873 – 170mm.
70014 Canberra Airport had 198.6mm which was exceeded by this episode in
March 1950 – 247.9mm in 6 days – there was also March 1989 – 190mm in 5 days incl 15 Mar @ 126mm.
70330 Goulburn Airport AWS had 155.6mm but only has records from 1994. So looking for other stations near or in Goulburn we find plenty that have had heavier 7 day totals.
70037 Goulburn commenced 1857; Mar 1914 – 186mm, Feb 1860 – 207mm
If you think that your relationship is falling and a lot of misunderstanding has been created between you and your partner, then sex will dispel these doubts. viagra purchase no prescription Do not use levitra pills from canada the medicine kamagra UK if you are using any other medicine for treating this ED issues as that can lead to over dose and give irreversible reactions on the body. It has try for info levitra samples powerful herbal ingredients in right combination to increase libido and love making desire. Generic drug manufacturers wholesale viagra pills produce cost effective anti-impotency medicines using this chemical. 70038 Goulburn No 2; Mar-Apr 1950 – 187mm
70263 Goulburn TAFE commenced 1971; Jan 2006 – 185mm, Aug 1974 – 203mm
63291 Bathurst Airport AWS had 140mm but 63004 Bathurst Gaol with data from 1858 records the following 7 day totals; Jan 1976 – 164mm, Feb 1971 – 190mm, March 1950 – 166mm and March 1926 – 153mm.
63231 Orange Airport AWS recorded 155mm and even data from that station showed these previous higher 7 day totals; Feb 1992 – 250mm, Apr 1990 – 169mm, Jan 1978 – 193mm, Jan 1976 – 199mm, Feb 1973 – 195mm. Orange Post Office has a dozen more heavier 7 day totals back to 1878 – but enough for now.
65111 Cowra Airport AWS recorded 165.2mm; while 63021 Cowra PO with data from 1885-1965 recorded the following; Feb 1992 – 212mm, Jan 1958 – 157mm, Jun 1925 – 195mm, Dec 1886 – 219mm.
So, the overall impression at those towns was of a very wet week that rolls along every few decades – but far from record breaking. The BoM has put out a “Special Climate Statement 39” – Exceptional heavy rainfall across southeast Australia, which includes some dodgy claims of less-than-robust records which I will comment on soon.
Sudden surge of spam purporting to be from Facebook
Just this week these type of long and verbose spam comments are being caught by the WordPress spam catcher. I am curious as to why the sudden burst of activity – over past years I have not seen much claiming a Facebook origin. Posting them as examples in case other bloggers are seeing similar rubbish coming in.
Continue reading Sudden surge of spam purporting to be from Facebook
Senator Bob Brown speaks truth
Readers have been at me to check out the ABC interview with Senator Bob Brown last night. I found these priceless words from Senator Bob Brown – “We all use metal. I drive a car.”
That is very perceptive Bob – but not enough to get my vote.
Continue reading Senator Bob Brown speaks truth
BoM summer outlooks – hopeless again
This summer has been cooler than average across vast areas of Australia. Which has been a surprise to the BoM.
The BoM 3 month summer temperature outlooks were issued in November – actual daytime temperature anomalies were cooler over vastly more area of Australia than the BoM predicted. The actual warmth along the Perth to Pilbara coast and Sth Aust & Vic turned out to be miniscule compared to the BoM predictions. Ditto for the Far North which turned out near average. The BoM scores some marks for their Eastern and Central Australian cool predict but all of their hot predictions turned out cooler and smaller.

The minimum (nightime) result is even worse than for the daytime – readers can see the actual sea of green for themselves.

And of course there is the National Nightime Hotspot again (marked N), evidence of a severe flaw in the BoM data that they seem incapable of understanding. Note the BoM has hardly commented on our cool summer – La Nina they would say.