While compiling the Autumn Temperature Outlooks piece – I noticed what looked like an aberration in the contouring of the Australian Bureau of Meteorology (BoM) Autumn minimum temperature anomaly maps here – features that were repeated in the monthly minimum anomaly maps for March – April – May 2011.
I am talking about the area near the SW corner of the Northern Territory (NT)- a remote region with sparse data where two stations in particular seem to be at the centre of aberrant contouring over many months – and I have checked back as far as 2002 where the feature shows very obviously month after month.
The two stations concerned are; Walungurru – Number:15664 Opened: 2001 – and Giles Meteorological Office Number:13017 Opened: 1956. Of course the two stations are very different – Walungurru at a remote community – only has a few years of data, and of course averages over the 1961-1990 period would have to be estimated from neighbours and this site suggests no neighbours are close.
I have not found a photo of the instruments site or found exactly where BoM Station Walungurru Number:15664 is located other than Lat: 23.27° S, Lon: 129.38° E, Elevation: 454 m. – and when I clicked on a map icon for details I read – “The information for this station 015664 is not available now, but it may be available in the future”.
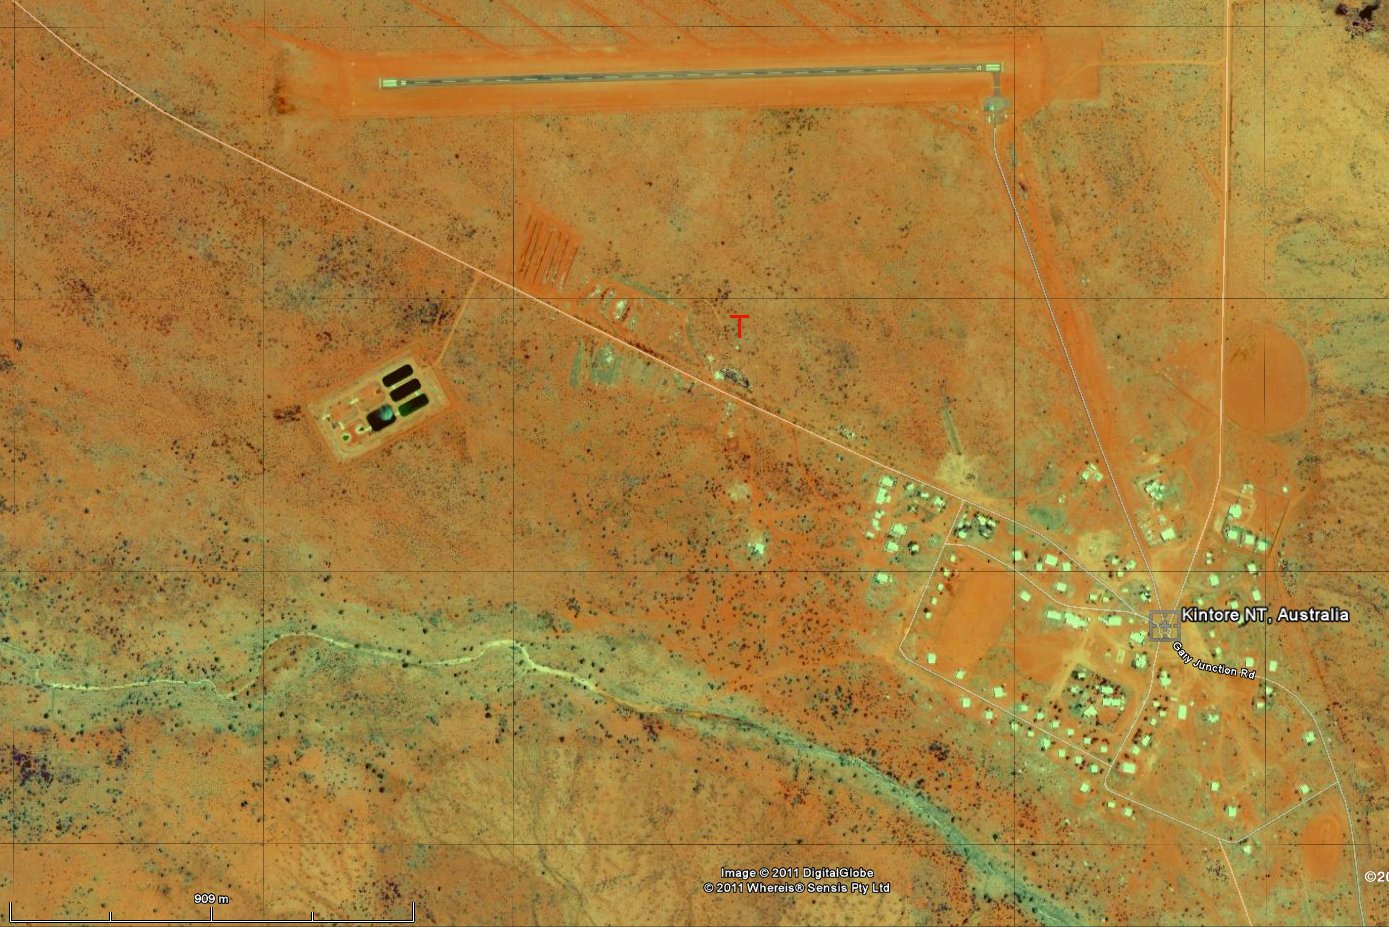
This image from GoogleEarth shows the layout at Walungurru / Kintore – the Lat-Lon plots just under the red “T”. It is a possible location seeing that public servants would attend the sewage/water works. I would expect to see a fenced enclosure.
Giles on the other hand is a purpose built – I expect state of the art – worlds best practice meteorological station.
This map of the Minimum Temperature Anomaly for Autumn 2011 has the approximate locations of Walungurru and Giles marked, the two places are ~220 km apart. We see in this map how the Walungurru data forms an anomalously warm pimple in the contouring while Giles is the opposite, forming a cool pit.

This pattern is too common to be natural see my 2002-2007 animation of annual minimum anomalies where Walungurru is always prominent.
You get the point. So often anomalous – I think it stands out that the BoM map construction has incorporated a problem.
This could be caused if the BoM estimated Walungurru anomalies for the 1961-1990 standard reference period assuming too great a warming in the minimum temperature. That could explain why the Walungurru site so often produces a “warm pimple” in the contouring which because of the mathematics of the contouring produces a dipole effect “cool pit” in neighbouring Giles, in effect preventing the more reliable Giles data having its proper influence.
And I have only picked one small area of the map.
Have a look at Sinclair Davidson’s graph:
what the actual global average temperature looks like.
catallaxyfiles.com/2011/06/05/world-environment-day/#comments
as a commentor says “I’m melting!”
o/t but GOOOOO Federer!!!!
Agree about the Fed Val – say Warwick – you should have checked your maps back into 2006-2005 – clearly we have a “National night-time HotSpot” – how mad is this. Amazing that nobody in the BoM notices this. Been goiing on for years.
o/t again but I’m confused (again)
here’s the disclaimer to the most recent Climate Change Report
www.garnautreview.org.au/update-2011/garnaut-review-2011/summary-garnaut-review-2011.pdf
This publication is produced for general
information only and does not represent a
statement of the policy of the Commonwealth
of Australia or indicate a commitment to
a particular policy or course of action. The
views expressed in this paper are those of
the author and do not necessarily reflect
those of the Commonwealth of Australia. The
Commonwealth of Australia and all persons
acting for the Commonwealth of Australia
preparing this publication accept no liability for
the accuracy, completeness or reliability of or
inferences from the material contained in this
publication, or for any action as a result of any
person’s or group’s interpretations, deductions,
conclusions or actions in relying on this
material. Before any action or decision is taken
on the basis of this material the reader should
obtain appropriate independent advice.
If you had gone to a doctor for a birth control pill at the time thalidomide was on the market you would have expected medical advice if the product was not safe – and because it was not there were later class actions; same applied in the case of breast implants
How come we so brainwashed (present company excepted) that we accept the contents of this latest Climate Change report when no one is prepared to accept responsibility for it?
Why are not Governments and their employees responsible for damages for policies they initiate when in the case of other professions Govt’s insist on accepted responsibility?
Question for the brighter than I am
Just a dumb jaffa thought, but is there a possibility that the site is adjacent to natural or man made heat sink/ store which short term stores & re-radiates heat locally?
I am sure there are protocols for sighting sensors, but there are comfort protocols for sighting dwellings/communities ( same fatal warmth “magnet” which draws cattle to camp overnight on bitumen roads.
I may be wrong but Walungurru looks close to where i know Kintore is, a large aboriginal community near Lake Mackay, a usually desolate but very large salt lake. I have not been there but someone who lived there said it was hot, dry and dusty. No trees, they had all been chopped for firewood. Giles has trees, lawns and gardens.
Walungurru was called Kintore, Lake McKay I would expect to be full of water at the moment, I would think that would account for warmer minimum’s?
BOM site is beautiful. Their web programmers sure know how to polish a turd. Dunno why gatekeepers of temp data insist on using common anomaly method; surely bright minds can come up with a better technique.