I noticed this aberration in BoM max anomaly maps –

on checking I see that Bedourie on 2 July recorded 19° at 3pm. Yet they have 30° recorded here.
So we are expected to believe that the temperature rocketed 11 degrees quicktime

It just amazes me that such an obvious outlier can get through BoM processes.
And I like the way the contouring maths generates the next layer up red anomaly all on its own.
There are not that many Qld stations reporting on this page – that given BoM computing power and the presumed importance of filtering out errors – a staffer could easily tick through the Qld list in 5 or 10 minutes each day eyeballing for obvious errors.
They did get rid of that cold anomaly we found nearby a while ago. So very good to see how a warm one gets dealt with.
www.warwickhughes.com/blog/?p=2691
Also interesting is the spot on the W.A. map. Not the maximum in that place, the miniumum anomaly map. At Salmon Gums Res.stn. 012071 there is green for 0 to -2. At Balladonia
011017,they also have green but inbetween the two was warmer. How do they know that?
Then it gets weirder. For Salmon gums that day they have a minimum of 11.6 which is 7 degrees above the mean! Now this could be mixed up with Norseman Aero 12009 but it shows above average on the data too.
Is it possible to get a photo & a site map of the BoM remote stations?
Perhaps the Bedourie Copper parked his vehicle too close & refleced sunlight was the the cause ( nothing like an artificial increase in TSI to give you a hand!)/sarc.
You would have to wonder at the set up where these odd stations like this & Giles seem to be so often right out of kilter.
It always ends up in the overall data set which is dramatically quoted on öur “ABC”.
Here is the WA hires gif map
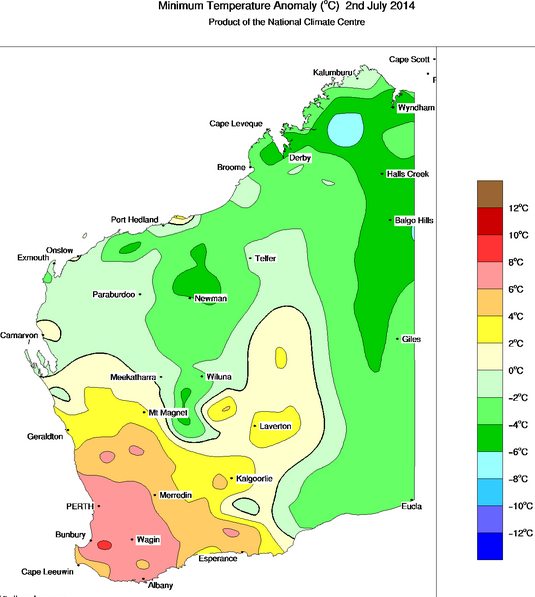
from –
www.bom.gov.au/web03/ncc/www/awap/temperature/minanom/daily/colour/history/wa/2014070220140702.hres.gif
They do not eyeball for hot errors, only cold errors. Hot errors are not errors.
Thanks Wazsah. It does look like i mixed it up and the mystery green spot is nearer to Norseman. Now about the rest of the confusion…
www.bom.gov.au/climate/data/index.shtml?bookmark=201&zoom=4&lat=-32.25662&lon=122.37585&layers=B00000TFFFFFFFFFTFFFFFFFFFFFFFFFFFFTTT&dp=IDC10001
That +8C red spot looks to be Salmon Gums. Max 25C that day. Ave 16C.
That area has 2 climates. One when warm dry winds blow from the north. The other when cold wet winds blow from the south. Large deviations from the average are common. Min temp was -4.3C 2 days later. Only 0.01C short of the record July low.
Thats all good Philip but how do they know that between Norseman and the great unmeasured zone to the north east there was a warm bit?
Hmmm
At the bottom of the great unmeasured zone is Forest 11052. It had 1 degree C min with an average of 5.1, so it should have shown as darker green for -4 degrees anomaly. Oh dear ooops Marla Police Station (Number: 16085) to the far east of the great unmeasured zone lost it’s reading for that day. Eyre Number: 11019 to the south west of it had 1.5 with a mean of 5.8 so it too should have been the darker green. I have not checked them all.
Map with other sites placed.
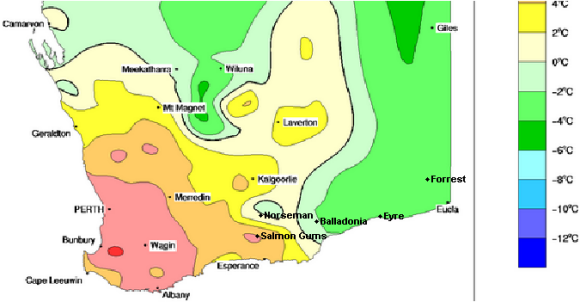
As you say siliggy – Eyre was 1.5 with a 5.8 normal makes it a -4.3 anomaly – as you say should be the darker green.
Forrest was 1.0 with a 5.1 normal makes it a -4.1 anomaly – also as you say should be the darker green.
At other times I have seen many instances where the contouring is not perfect but generally in more complex areas where data is closer. In this case I can not see why Forrest and Eyre were not shown with correct colour contours. Plenty of sites further west have minor warm “islands” plotted.
Turn the heater up, our average minimum in Broome so far in July is 4.8C below the average.
Nope – no problem there – www.bom.gov.au/climate/dwo/IDCJDW4009.latest.shtml – seems to be correct.
BTW Warwick – have you researched those old files yet?
George