The BoM say of Rutherglen:
This site is an automatic weather station located on the grounds of a research farm, about 7 km southeast of Rutherglen and well outside the town area, on flat ground over grass (farm paddocks) but with low hills a few hundred metres to the north. A gravel road (carrying farm traffic only) is a few metres to the west of the site.
History
There have been no documented site moves during the site’s history. The automatic weather station began operations on 29 January 1998.
But the BoM soon make Rutherglen safe for “global warming”…
Just two presentations here ACORN max and min compared to Rutherglen Research and a few near neighbours. Corowa is listed as an airport but must have started as a post office or similar.
Rutherglen Research is plagued by gaps. There are no ACORN adjustments to the max after Dec 1949 – There is a large gap in ACORN from 31 Oct 1959 – 2 Jan 1965 – a gap well known in Australian T data.
Yet CDO monthly data has numbers for that large gap except for Apr 1963 and all 1964. Differences between Rutherglen Research raw and ACORN chart points after 1950 are probably due to me averaging daily ACORN dailies into years – plus the fact that 82039 has no shortage of gaps. For example ACORN dailies have no data for Oct-Nov-Dec 1957 and 1959 has no dailies for Nov and Dec.
Comparison of max T – ACORN adjustments have no major effect on trend –

My point here is there is no sign of minimums in the Rutherglen district as cold as the BoM fabricated ACORN 82039 1913-1950’s.
So how on earth can these huge ACORN adjustments be justified?

Just an observation re Rutherglen Research v ACORN for 1913.
For each month, (except Feb, Jun and Oct), the daily maximum temps were adjusted by exactly the same amount.
eg Jan – each day adjusted down by 0.4C.
Apr – each day adjusted up by 0.5C
Sep – each day adjusted up by 0.2C
Nov – each day adjusted down by 0.3C
For Feb, Jun and Oct, ACORN data reflected the raw temps (i.e. no adjustments).
I have often posted about the raw max temps for Bourke v ACORN for Jan 1939. They at least have different adjustments for each day where comparisons with other stations may have been a factor.
There seems to be no justification for these adjustments at all.
Data does appear in the map archives for 1963/64
Here is a snap for April 1963
picasaweb.google.com/110600540172511797362/TEMPERATURE#6004315889260169986
source
www.bom.gov.au/jsp/awap/temp/archive.jsp?colour=colour&map=maxanom&year=1963&month=4&period=month&area=vc
The BOM calls this data..high resolution gridded temperature analysis
quote
www.bom.gov.au/climate/change/acorn-sat/#tabs=Methods
For example the Bureau maintains a real-time monitoring system that uses the entire observational network to create a high-resolution, gridded temperature analysis. The Bureau cross-checks these real-time data with the ACORN-SAT dataset.
The link for griided temperature analysis goes here
www.bom.gov.au/jsp/awap/temp/index.jsp
www.bom.gov.au/climate/change/acorn-sat/#tabs=Methods
quote
“Additionally, the Bureau maintains multiple temperature data sets – analysed in different ways – to provide a consistency check on the accuracy of temperature observations. For example the Bureau maintains a real-time monitoring system that uses the entire observational network to create a high-resolution, gridded temperature analysis. The Bureau cross-checks these real-time data with the ACORN-SAT dataset.
The link to high resolution gridded temp data goes here
www.bom.gov.au/jsp/awap/temp/index.jsp
Here is a snap of April 1963 ..VIC ..Max temp anomaly
picasaweb.google.com/110600540172511797362/TEMPERATURE#6004315889260169986
source
www.bom.gov.au/jsp/awap/temp/archive.jsp?colour=colour&map=maxanom&year=1963&month=4&period=month&area=vc
Re April 1963 gap in CDO – those monthly contoured maps I think rely on the AWAP data – Australian Water Availability Project (known as AWAP)
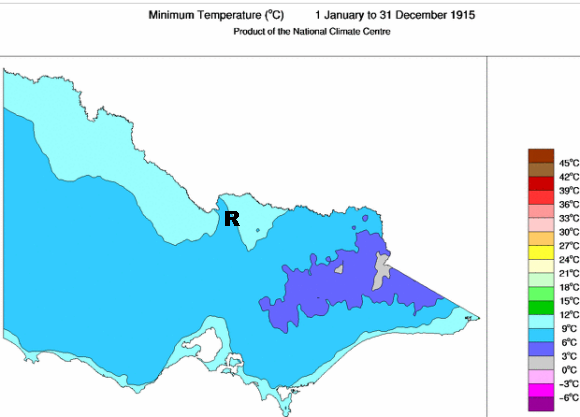
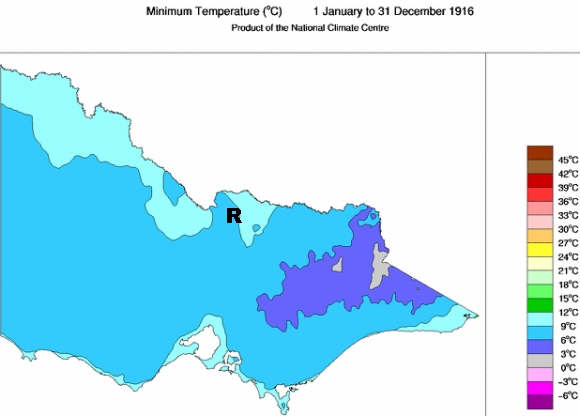
Note how these countour maps of Twelve-monthly mean minimum temperature for Victoria 1915
&
1916 –
show Rutherglen to be situated near the 9° contour not 6 degrees as ACORN has Rutherglen – see my minimum chart – second in the main article.
So in affect ACORN has moved the 6° climate contour about 130km from the alpine foothills to Rutherglen. Clever.
you might have to delete some of those multiple posts above Warwick. Not sure what happened there.
Gee. This is a technical topic . Adjustments at many levels of the ‘quality control’ process.
www.bom.gov.au/climate/austmaps/about-temp-maps.shtml
Adjustments are largely made based on this publication l believe
ANALYSIS TECHNIQUE
www.bom.gov.au/amm/docs/2009/jones.pdf
That page was a good read –
www.bom.gov.au/climate/austmaps/about-temp-maps.shtml
what are they saying – we are checking the best we can – there is too much to do without automating – the whole thing has grown like topsy –
In 2011 I wrote on the – Non-climatic anomalies in BoM temperature anomaly maps
www.warwickhughes.com/blog/?p=1029
This was termed the National night-time HotSpot in a comment –
I have told the BoM about this – but if you check 12 month min anomaly maps 2004–2005–2006–2007 you see this error still infests their gridded data. So if I can find a standout error like this – how many more subtle errors must there be?
The NNTHS fades after 2007 until seen again in 2011 then vanishes for 2012-13 – but a similar error seems to be cropping up at Jervois to the east in the NT.
JO NOVA has a blog post with a critique on RUTHERGLEN ACORN station
joannenova.com.au/2012/06/threat-of-anao-audit-means-australias-bom-throws-out-temperature-set-starts-again-gets-same-results/
jonova.s3.amazonaws.com/graphs/australia/rutherglen-minima.gif