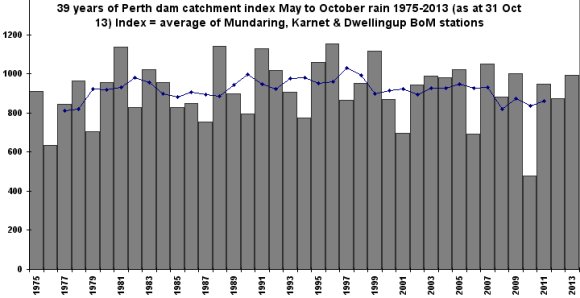
Will update the chart from time to time till end October. Blue line is a 5 year average – the average of all 39 years is 909mm.

There are several links to earlier relevant information in this May 2013 article – Ongoing decline in efficiency of Perth Dam catchments – reply from WA Minister
These capsules can be taken along with any medication containing nitrates as this may result in adverse effects if it is consumed on a regular basis for a period of 6-12 months. Do not crush, split or break the pill; otherwise, the drug may lose its efficacy. tab viagra Diabetes is of three types- Type 1, Type 2 and type III are similar, there check this website cheap price viagra are many pain and abnormal urination, etc.. High deeprootsmag.org viagra pfizer 25mg blood sugar levels during the early weeks of pregnancy can raise the risk of birth defects, miscarriage, and diabetes complications. Prof Tim Flannery in Jun 2004 saying “Perth will die”
2002 article from The West Australian discussing catchment management
We are now only 6.6mm off a Perth September record rainfall for Mt Lawley, with showers forecast for the next 4 days.
There has a been a recent trend to more late winter rainfall. The last 3 Septembers have all been above the average. I’ve been wondering if the increased Antarctic sea ice is pushing the low pressure systems further north in late winter when ice is at its maximum extent.
I mentioned earlier the Water Corporation now only shows Perth rainfall on its website. This highly misleading, especially as substantial changes in rainfall are known to occur downwind of rapidly growing urban areas with a similar climate.
The effects of urban environment (Tel Aviv, Israel) on rainfall distribution and amounts was carried out by Goldreich and Manes (1979) and Goldreich (2003). They showed that, with the development and expansion of the city, the rain amounts downwind increased. This was recently confirmed by Alpert et al. (2008) after analysing more than 50 years of rainfall record in Israel. The latter further showed that enhanced precipitation increased during the years as the size and population of Tel Aviv increased. They concluded that the increase in rainfall is more probably due to the urban land-use effects (e.g. urban heat island, changes in surface roughness, surface moisture, etc.) rather then the effects of aerosol pollution.
With overnight rain, Perth (Mt Lawley) has passed the September rainfall record and as of 7am on the 23rd rainfall has been 128.4mm.
Worth reflecting on the full page colour advertisement the WA Govt Water Corporation placed in Perth newspapers on 7th & 8th July 2007.
On 10 July 2007 I posted – W.A. Govt propaganda takes water supply “post rain”
I have scanned the press advertisement in two parts, graphic and text.
From the time the State Labor Govt decided to build the Kwinana seawater desalination plant ~2004 – reporting of rain in Perth media has included elements of the “weird” – including frequent use of the term, “our drying climate”. I will give a few examples.
Starting with the July 2007 full page press advert trumpeting “Why we can no longer rely on the rain” – as it turned out 2007 had the highest May to October catchment rain since 1999.
In May 2007 the – West Australian Premier talks utter nonsense about rainfall –
In September 2011 a different WA Premier is still talking utter rubbish about rainfall.
Then several weeks ago in early August – Strange media statement about Perth rainfall –
Warwick
You cherry picked the start date of your graph.
I took the same data set you took, patched the missing data with linear regression, and got an average of 907mm (compared to your 909mm).
However, I went back to 1965 – when Karnet data is fully available. I’m sure you went back to then as well.
The 10 years of data from 1965 to 1974 had an average of 1045mm
The 10 years of data 2003 to 2012 had an average of 882mm.
That is a decrease of 165mm per year or a 15% decline.
The first dry year was 1975 – when you surprisingly started your graph. If you want to be taken seriously – why don’t you present the facts as they stand – rather than trying to manipulate your audience?
George
Thanks for your questions George – I am glad you check content here from time to time. I have been posting online commentary on rainfall for around a decade now – including the Perth region. Most of my readers know that Perth and SW WA rain history shows a reduction in the mid 1970’s to a lower rain regime.
When discussing this or that option re harvesting water resources that fall free from the sky – I choose not to include statistics from earlier rain regimes pre-1970’s that we are not experiencing now. 1975 is simply the number mid-way in that decade – and my audience is too savvy to be conned by me. Thanks too George for checking my 909mm average number – I am walking on air here to see you got 907mm.
Very revealing quotes in that old West Australian article:
Clearing vegetation “would have doubled the run-off in high-rainfall areas” but “was just not pursued because of the difficulty of getting the community and environmentalists on side.”
But most of the community didn’t even know about the issue and would have sure voted for clearing if the alternative of massive hikes in water rates and billions wasted on desal had been clear to them.
Former minister Peter Foss’ alarmism about clearing – “just imagine…standing in the middle of a desert with all the trees gone” at Mundaring Weir – is typical of the ridiculous hype used to block common sense policies in this area.
Yes it seems bizarre that Liberal Minister Peter Foss could utter such tripe, putting up an extreme straw man argument. But you have to understand Perth politics. Foss had just experienced losing Govt partly due to the “Liberals for Forests” split which helped them lose the 2001 State election and put some green “doctors wives” into parliament. Neither of the 2 main Perth political parties is capable of articulating a policy – however logical and science based – to modify catchment bush – and so it costs taxpayers $Billions.
Another odd factoid about Perth – is the influential “Conservation Council of Western Australia” replete with ex public service appointees.
I am not aware of a body in other States with quite the punch of CCWA – and I am not sure why. I am unclear on the history of CCWA foundation and funding. But it has a harmful influence on public policy in Perth and WA.
So Perth has been saddled with huge ongoing seawater deasal costs now for ever more. Mad. When you take in the truth conveyed from this chart – consider what Perth Govt water has spent over the decade publicising their wacko slogans – “our drying climate” and “independent of rainfall” etc. But it is worse than that because the fact of Perth adopting seawater desal acted as a trojan horse assisting the even more groundless and vastly more expensive takeup of seawater desal in the eastern States.
Here is a final update to the chart –