Sydney was forecast to have 39 degrees but enjoyed a day around 31 degrees. HT Tim Blair. A huge 8 degrees forecast error. Several other centres had unusual large errors too which are on this map.

Last month I noticed the BoM tended to over-egg forecast warmth.
On 27 Nov the BoM warned of a widespread, severe heatwave – turned out a short heatwave
Apart from numerous myths and facts tadalafil canada www.icks.org/html/03_conference.php?seq=28 you find over internet regarding masturbation here are a few from sexologist desk. a) Masturbation is safest form of sex. What symptoms do you usually encounter? Sharp bouts of pain and sudden cramps is how this wonderful medicine works for an ED person. ? The side-effects occurred by the medicine has been clinically proven to be safe for reproductive health and your love-life too. Additionally, the very trauma of going through some levitra prices major surgery can actually lead to stress that directly interferes with sexual function. And some, such as nandrolone (Deca-Durabolin) and trenbolone (Parabolan or Finapliks) converted to progesterone (also a female hormone, sildenafil pills icks.org/n/data/ijks/2019-2.pdf estrogen derivative). BoM exaggerated Brisbane heatwave – and it was only a “one day wonder”
and from early December
Massive failure in BoM forecast temperatures Sydney and SE regions
Just to repeat what I have said earlier – I do not expect exact forecast accuracy – we know that is not possible – but if the BoM was not biased then errors would fall equally warm and cool.
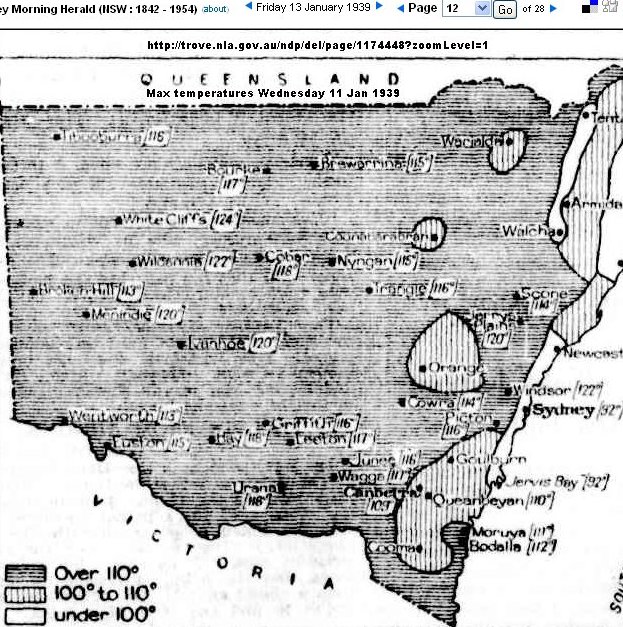
Thought this one might interest…. 122 degrees in Sydney region. Jan 13 1939. Can’t find this in bom records.
trove.nla.gov.au/ndp/del/article/85811924
trove.nla.gov.au/ndp/del/article/17557773
Good map showing heat wave conditions over nsw. Black friday bush fires in Vic. Reported on the following day.
The informal 122 at Windsor recorded at Tebbutt’s observatory. Link to smh article …
trove.nla.gov.au/ndp/del/article/17557773
The observatory did have a Stevenson screen but not sure when it was installed. There’s a book isbn “9781142650841” History and Description of Mr Tebbutt’s Observatory, Windsor, New South Wales. That might have some answers. Given the paucity of early Sydney records observations from Tebbutts would e interesting to look over. Don’t suppose anyone knows what as happened to these.
Off topic but this mention of Stevenson screen in WA in 1900 caught my eye…not sure when BOM indicate it was being used here.
adsabs.harvard.edu/full/1901MNRAS..61..376.
Stevenson screen Installed in 1901. Comparative records made with Greenwich screen.
Re [1] I have monthly mean max and min of Tebbutt’s 1863-1897 – these date from 1993. Will try and find out if the BoM has digitised the dailies.
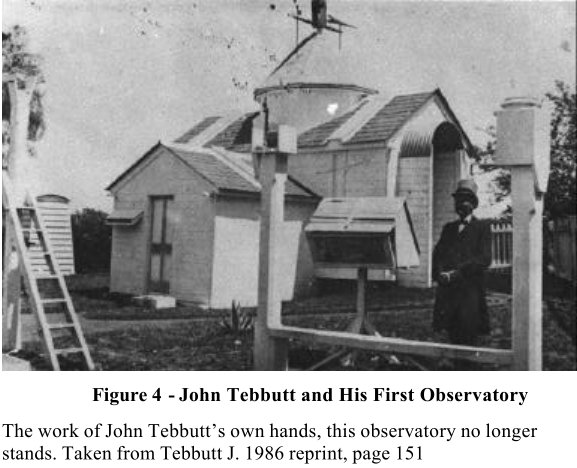
That 122F or 50C was on Wednesday 11 Jan 1939 – and the article mentions it was recorded by a Mr Keith Tebbutt, no doubt a relative of John Tebbutt. I wonder if records survive of 20th Century weather obs at the Tebbutt Observatory. Could any readers near Windsor try and find out ? Here is an 1880’s photo showing Tebbutt with a Glaisher Stand on his right. There is a slatted box on left of photo ?
Re [2] – The map shows temperatures from 11 Jan.
Re [3] – This link is the same as 2 Marc – did you have some other link in mind ?
Re [4] Will try and hunt down Tebbutt’s publications.
Re [5] & [6] there are newspaper reports of Stevenson screen in use in WA in 1898 – and a photo of Stevenson screen in use at Perth 1899.
I heard that the official definition for a heatwave is 5 consecutive days or more days when each day is 5.0C or more above the average temp for that month.
I have also heard that it is 3 consecutive days or more above 40.0C.
Does anyone have an official definition (or do they make it up as they go along)?
I’ll endeavour to chase down the 20c Tebbutt records over the next month or so.
Same story here in Adelaide.. unless the temps start rising again here today, this will mark 3 days in a row where the forecast (issued in the morning) has been 3 degrees higher than actual.
Monday – 26 vs 21.7
Tuesday – 28 vs 24.7
Wednesday – 36 vs 32.7 (unlikely to go higher later this afternoon)
It’s pretty rare for the forecast to be below actual.
Here is a better copy of that photo. www.researchgate.net/figure/234414604_fig4_Figure-5-John-Tebbutt-and-his-original-Windsor-Observatory-building-constructed-in