This puzzles me.
In early March I questioned the BoM about a possible discontinuity in Perth Metro readings in July 2011 which had the effect of seeming to increase Perth Metro temperatures relative to Perth Airport.
The BoM reply dated 21 March (see below) said that their readings at both sites were correct and that the 2011/12 summer heat in Perth Metro and Swanbourne relative to “sites further inland”, which I assume includes Perth Airport, were “…potentially attributable to very warm conditions recorded in local sea surface temperatures and observed weaker sea breezes.” My 22 March post re the first BoM reply – see my comment 2 with their second reply see below.

I am amazed the BoM never mentioned these SST and weaker sea breeze factors in their “Perth seasonal climate summaries” for 2011/2012 Perth in summer 2011/12: A wet and warm summer and 2012/2013 Perth in summer 2012/2013: One of hottest summer
If the warm SST ‘s and associated weaker sea breezes are a factor in hiking Perth Metro summer max temperatures up to near the warmth of Perth Airport – then this is surely vital and very interesting information about the Perth climate to share with Australians.
I think this graphic says something about 2011 Added 5 Apr – meaning summer 2011/2012 which is labelled 2012.
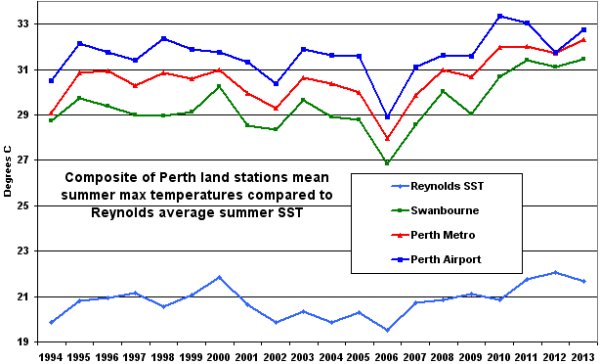
I tried to use the Bom site to get recent year’s maximum anomalies for Northam and York, beyond the sea breezes, without success.
However, the 3 month max temp anomaly, jan to march map, shows only a small <1C anomaly for the whole of the SW of WA, for supposedly the hottest summer. Go figure.
www.bom.gov.au/jsp/awap/temp/index.jsp?colour=colour&time=latest&step=0&map=maxanom&period=3month&area=nat
A comparison below of Perth Metro, airport, Swanbourne and Jandakot averaged daily summers 1995-2013. Jandakot has an elevation of 30m vs Metro at 25m and long of 115.87 vs 115.88. i.e both similarly inland and elevated. Among the four, Perth Metro looks most out of synch from 2011.
How about winter max when the Leeuwin current has retreated and sea breezes don’t happen as such? Below are Perth Metro and airport winter max with Metro again getting some hormones as of 2011.
The airport winter max are charted back to opening in 1945 to illustrate an upward plateau shift in its winter averages from 1994. That’s the same year Mt Lawley opened, which is a bit convenient. Perth Airport’s air temperature equipment history is also a bit inconvenient:
20/JUN/1994 INSTALL Temperature Probe – Dry Bulb (Type Rosemount S/N – 0265) Surface Observations
Different model but similar to the equipment update at Perth Metro:
07/JUL/2011 REPLACE Temperature Probe – Dry Bulb (Now Rosemount S/N – 10319) Surface Observations
Perth’s temperature history seems sensitive to equipment changes.
The img quicktag doesn’t work so to make sense of above, either click or paste below …
A comparison below of Perth Metro, airport, Swanbourne and Jandakot averaged daily summers 1995-2013. Jandakot has an elevation of 30m vs Metro at 25m and long of 115.87 vs 115.88. i.e both similarly inland and elevated. Among the four, Perth Metro looks most out of synch from 2011.
www.waclimate.net/imgs/perth-airport-swan-jan-summer.gif
Below are Perth Metro and airport winter max with Metro again getting some hormones as of 2011.
www.waclimate.net/imgs/perth-winter-difference.gif
South West WA has become a bell wether for the warmenistas for some time – “Look, AGW is already impacting SWWA, South East Australia is next.”
There is no doubt that the climate has changed in SWWA or rather reverted to conditions extant during 1600 to 1900 AD!
The 2009 Annual Report of the Scientific Committee on Antarctic Research (SCAR) p43
“The work in progress indicates that southwest Western Australia experienced periods of higher mean winter rainfall, with high interdecadal variability during 1300 to 1600 AD, followed by lower mean but less variable winter rainfall from 1600 to 1900 AD, which is similar to the past 50 years (Goodwin, in prep.)”
Climate change doomsters sure have dined out for years on SW WA rain trends post mid 1970’s being the fate of the rest of us. The WA water authorities and WaterCorp have been leaders and their post-rain propaganda has all been worked in to the successful pro-seawater desal construction push in the Eastern States. That our Grandchildren and their offspring will be paying for.
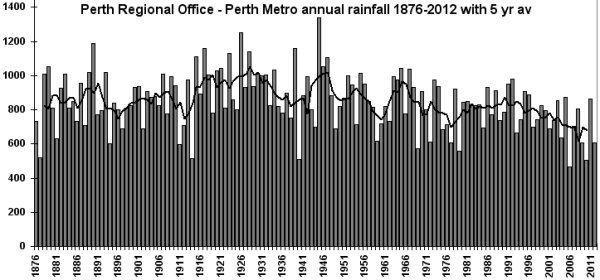
Here is the Perth annual rain data –
and I have often pointed out that the period 1876 to pre WWI the totals look more similar to post mid 1970’s than the high rain years 1915 to ~1970. And who is to say what is normal ? The doomsters assert that the high rain years are “normal” and that “climate change” has taken our rain.
I see there is a Fremantle station 9017 with three totals from 1853 869.2mm, 1854 757.7mm & 1855 768.9mm which lend support to the notion that pre WWI rain levels were in a lower band than 1915-1070.
It will be welcome if there is some fresh research in the pipeline to provide an alternative view to the decade of propaganda.