This ABC online story quoting an experienced north Queensland storm chaser starts to reveal the truth that Yasi was unlikely to have been a category 5 cyclone as it hit the coast – the damage simply is not there for that. Luckily for residents windspeeds must have decayed quicker than we have been told. Just to remind us what cyclone damage can look like –
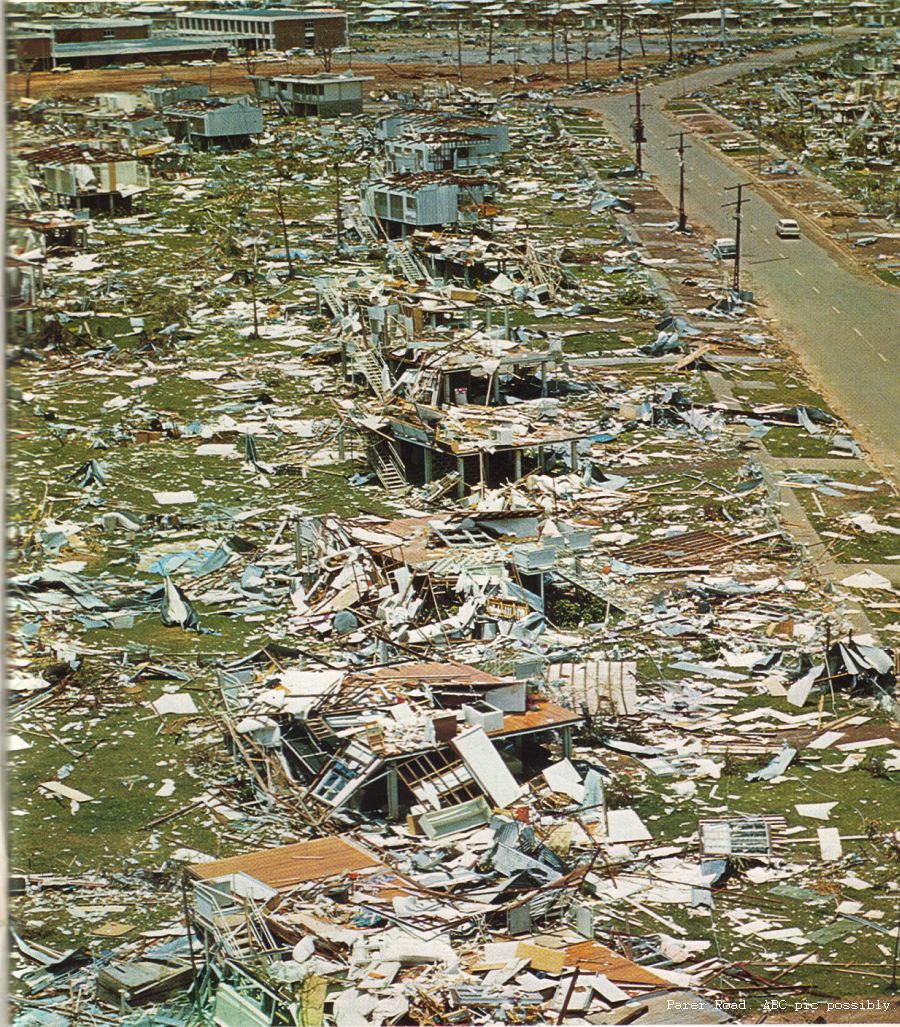
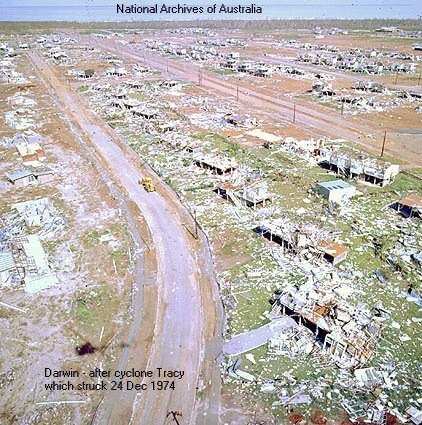 here is a photo of Darwin after Tracy (thanks National Archives)
and here is a website with other photos.
I have thought all along that the BoM sticking with their first 295km/h “estimate” has been misleading – and we have all heard the Govt hype then further media hype on top. Even now 8am on the 4th the Ch9 Today TV show is beating up pictures of damage – which show many houses near intact – luckily for most residents.
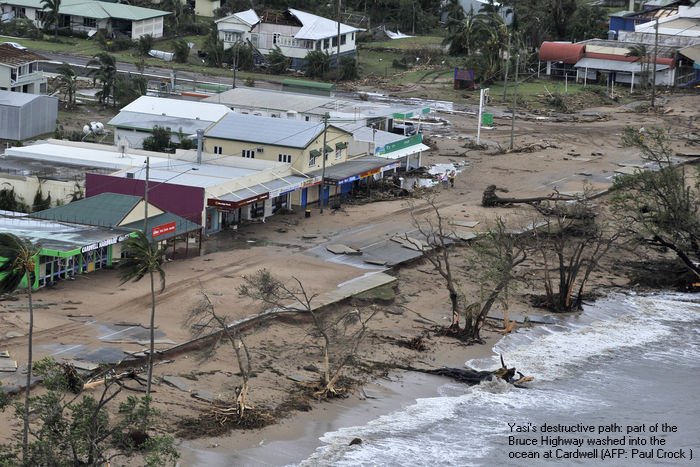
This photo from the ABC on an article about damage at Cardwell
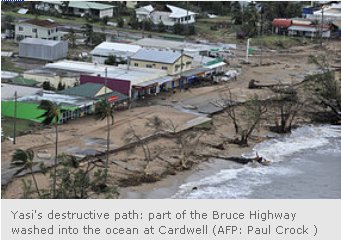 – on examination shows only moderate damage. Click for larger version. My comments – in a cyclone prone region shops and houses are built this near the coast ? I see two places with roof damage yet the row of beachfront shops with their verandahs and service station with forecourt roof are pretty intact. Also at far right the quite large pretty fragile looking carport/leanto looks OK.
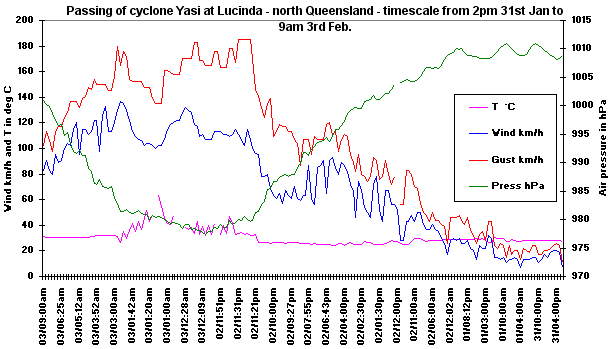
My graphic of weather obs data from Lucinda – ~80km south of Mission Beach which has been quoted as where Yasi crossed the coast. These are the closest obs to the Yasi track I can find on the coast. Note the temperatures up to +60C – obviously some instruments went haywire for a while.
“These are the closest obs to the Yasi track I can find on the coast”
Same for me. It’s a shame Cardwell doesn’t have continuous data like Lucinda. You’d think in this day and age that wouldn’t be a problem.
the courier mail www.couriermail.com.au/ has more pics
(haven’t seen any photos of Cairns but might have missed them)
here’s the Weatherzone page for Lucinda Point.
www.weatherzone.com.au/station.jsp?lt=site&lc=32141&list=ob
I note the pages are blank janama – the instruments seemed to go offline the morning after Yasi.
Interesting what is happening to Yasi – as of now (~1.15pm 4th) the centre is near the Qld – NT border about 340km north of Poeppel Corner. This Cola weather model site shows how they think it will evolve out to 9 Feb. On 6th to 8th they see Yasi wending its way SW into the Bight – against the usual west to east flows. The weather forecast model is from NOAA / NCEP.
woops – sorry Warwick – it was working when I posted it.
here’s a pdf I’ve made of the data.
users.tpg.com.au/johnsay1/Stuff/yasi.pdf
for your records here’s the Lucinda Point Data.
users.tpg.com.au/johnsay1/Stuff/yasi_lucinda_point.xls
I think you need to look at a few more photographs…and so what if the cyclone had weakened a little before landfall? Just how serious is ‘government exaggeration’ if [speculative] the max winds fell in the last hour before landfall to ‘only’ 270,or 250km/hr? It’s hardly going to change the details of a warning is it,when you can be decapitated by flying objects at half that speed?
Sure,the media rode it for all they could,and coverage was obviously repetitious and overlapping between the outlets. Hardly surprising that they wanted to chase the biggest ambulance to cross the coast for how many decades?
Yasi dropped pressure below 940hPa at Willis Island before the facility failed. It passed over or near a buoy at 11AM on 1/2/11 which shows pressure falling 60hPa in 12 hours to a low of 941hPa. All pressure estimates from international agencies had it below 940,one as low as 902. This BOM Cat 5 territory. JTWC had at at Saffir-Simpson 4,with winds of 135 knots
The official approach was saturation warning of worst case scenarios,and I do not think that inappropriate,as the possible point of landfall lay over a distance including Cairns and Townsville.The eye remained large and perfectly defined until some time after landfall. The fact that it was causing contemperaneous physical damage at all points between Cairns and the Whitsundays is an indication of the systems immense size.Just wait to estimates of storm surge heights come in for Tully Heads.
Kandler – the records show it was a 185km cyclone. That’s why everyone is amazed there was no loss of life because they’d been told it was a Cat 5, 290km cyclone.
“…it was a 185km/h cyclone.” AT LUCINDA,well south of the eyewall zone of maximum wind intensities where pressure did not fall below 977hPa.
The DERM barometer at Clump Point tide gauge,Mission Beach,which went into the eye at around 12.30AM,recorded a pressure of 930 hPa,janama….Yasi made landfall at 930 hPa,Cat 5 BOM wind gusts 280km/h +,Cat 4 Saffir-Simpson,. Records show that the Willis gauge was destroyed 30km out from the most intense winds,at the eyewall,and that the Lucinda gauge,the only BOM automated recorder,was never any closer than 50km from the eyewall.This can clearly be seen to be true if you run the Townsville radar loop at 256km for the period.
The eye went over Dunk Island heading WSW,Mission Beach-South Mission beach Tully Heads and Tully itself,with Cardwell just off the southern edge of the eyewall.
This cyclone was not ‘exaggerated’ by government or BOM. The range of possibilities for landfall was reflected in the scale and level of the emergency response. There was no loss of life-or none so far detected- because of a large and timely evacuation program and a good number of cyclone rated structures built after Larry had picked off the weaker structures around Innisfail in 2006. Also because one very perspicacious lady decided to move her group of evacuees from the Senior Citizens Centre in Tully to a structure she thought was more sound. She was proven right next morning,with the SSC destroyed. Preparation saves lives,j
Another GovtScience/media exaggeration were the statements by a wide range of spokespeople re unprecedented hot sea surface temperatures (SST) in northern Australia being the cause of Yasi.
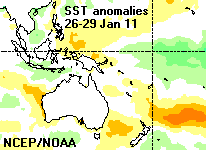
This map of SST anomalies from NOAA/NCEP for the week 23-29 Jan shows clearly there were no abnormal SST’s in the Fiji region where Yasi developed.
I have another map for the 3rd Feb which likewise has little evidence of high end warm seas (NOAA source) – if anybody knows a six y o who can make daily maps for the week prior to Yasi from these GRIB files – that would be great.
WSH,TCs Yasi,Wilma and to some extent Anthony have harvested that anomalous heat over the last two weeks or so. Yasi formed by the 27th and tracked westwards from Fiji with a very large cloud mass at all times.
Warwick, any reliable figures on the air pressure?
Here are the last data for Willis Island Marc – after it shut down on Yasi morning.
Also SST’s for the 1st-26th Jan. I can not yet see signs that sea conditions were unprecedented – the term used much before Yasi struck.
Marc @ 12,DERM Clump Point,recorded Yasi at 930hPa on landfall.
The tide gauge at Clump Point recorded a 3m high storm surge, 70cm higher than that of Cat 4 Larry in 2006. The southern eyewall of Larry came ashore moving E-W just north of Clump Point.
Nowhere else to post this, but ‘exaggeration’ seems a good spot. In Sydney they are endlessly claiming a “record heat wave” of 7 or 8 days above 30 degrees C for the first btime. Now I wonder why 30C was such a big deal anyway even though we did have days of 40C in that week. However, when I checked the only days I could for Observatory Hill I note that on 4 February it hit 30C for less than an hour on that day (Below 30C, exactly 30C and below 30C all in three readings over one hour).
Warwick, I noted how you looked at the supposed record Melbourne night temperature a while ago and wondered if the Heat Island effect you saw there is repeated here? If the previous ‘record’ was some time ago that might be relevant, I guess. Homebush was the same 30C split by the way (one reading only), but as they claimed tonight it was an ‘Observatory Hill record’ that wouldn’t matter anyway.
At the very least, it did not seem to warrant the 35 or so media mentions all week.
Kandler,
Don’t think anyone would disagree with you that the Bureau was right to push the panic button before the cyclone hit. Yasi was a very large very powerful cyclone and evacuation and other more or less drastic preparations were called for.
The issue is more just exactly how bad the cyclone turned out to be. Seems it weakened a bit before it came ashore, and immediate damage was not as bad as feared. That’s something we ought to know. Not to beat the BoM about the head with – everyone knows forecasts are not going to be perfect – but just to know exactly what happened and how it compares with other events, and, yes, with forecasts.
Where the BoM is not doing a good job is that – as far as I can see – they have not posted any detailed synopsis of this. Sites everywhere continue to repeat the 295km estimate as a landfall figure which would be truly extraordinary but in fact is probably a good deal higher than reality. Why hasn’t the BoM got a simple summary of the Yasi event up on its site, and a detailed loop with estimated wind speeds at close intervals for the crucial few hours around landfall?
Actually, you seem to know more about Yasi than I can find on the BoM site at the moment. Could you give us some of your most informative urls so we can all learn more? After your info, I find more on NASA’s site than on the BoMs.
It was downgraded to a cat 4 then a cat 3. So what? If it was under estimated more people would have been hurt through lack of preparednes. In either case you would still be screaming ‘government/media conspiracy’.
Thanks Dave – yes most people would expect the BoM to accurately describe the history of Yasi in the aftermath – for posteritie’s sake. I thought that was the way an advanced society did things.
Re the Sydney (and all other) UHI’s W Brown – of course the UHI must impact records from cities such as “so-many-days-in-a-row-over-XX-degrees” that the BoM/media beats up. If anybody sees a ref to UHI in these cases, please let me know, I have never seen that, so it might be a record in its own.
I have some old pages touching on the Sydney UHI – scroll down over half way and I ask “How big is Sydney’s UHI effect? ” – under that is a few lines re what the BoM found in a 1990 draft paper.
More recently I put up this graphic showing growth in the annual mintemp in Melbourne compared to the more rural Rutherglen.
David, that NASA site is excellent. BOM have a place-holder at this page. The DART buoy data in the last graph is from further out in the Corals Sea. DERM tide/pressure data has to be requested.
There seems to be no evidence that the cyclone weakened over its last day at sea,and because it came ashore in a an area with a population of a collective 10-15,000 in scattered towns and localities,rather than Cairns or Townsville,we seem to have gotten away with it a bit. Damage is however spread over a very wide area,and the crop damage is major.
Warwick
I believe I heard a reference to on shore winds in Sydney so I guess the UHI would have only enhanced the terrestrial heating in Sydney over the last couple of days.
Another take kenskingdom.wordpress.com/2011/02/07/how-strong-was-yasi/
by Ken Stewart
His conclusion
Therefore, a defensible estimate for windspeed in the Cardwell-Mission Beach area would be in the range 220-240kph. This indicates it was a low Cat 4, not Cat 5.
Yasi was indeed an enormous system in area covered by cloud, the largest we’ve seen in the satellite era. The zone of maximum destruction (and winds) extended from roughly Silkwood to Cardwell, a distance of about 60km. The storm was roughly the same strength as Cyclone Larry but took longer to pass. Remarkably, it was still classed as a cyclone at Julia Creek, the furthest inland a cyclone has been recorded.
Contrary to many alarming reports, it was not the deepest cyclone (10m, 1899 or Mission Beach 3.6m 1918) nor the the most rain (907mm in 24 hours at Crohamhurst, 1893) nor the deadliest (307 known fatalities, Bathurst Bay, 1899).
Which is no consolation for the residents of Cardwell, Tully, and Mission Beach.
Ken Stewart is an authority,Val?
If you read Ken’s report you will immediately realise the foolishness of challenging a person based on “authority.”
Now – nearly a week after Yasi our great authorities tease out this information that 150 homes were destroyed. See ABC online news “Cyclone Yasi destroyed 150 homes” – my first thoughts – they did get off very lightly for a cat 5. Has anybody got an online ref to statistics describing the rebuilding of Darwin post cyclone Tracy ? I see in this wiki that 3000 homes were rebuilt by “the following April” – four months sounds optimistic – would they mean April 76 ?
Surely the destruction was categorized and all the rebuilding summarized somewhere.
Found this 2008 paper by GA people – on the BoM webpage.
Says 3675 Darwin houses destroyed in 74 out of ~8000.
Good article here on the Perth fires and Green opposition to controlled burnoffs.
A note re cyclone Yasi – it is just visible on the satellite animation rotating in central WA near Lake Carnegie (east of Wiluna) heading for ~Geraldton.
Lindsay,Ken is claiming that ‘many people’ have ‘noticed’ that Yasi was ‘nowhere near as strong as expected’. How many people? In what way have they noticed? What does ‘nowhere near’ mean? Can we quantify that? I don’t see Ken working through the standard estimating techniques of the field,or give a reason why he selected one estimate over the next. Is it not conservative to work around the AMSU/SATCON estimate as well?
He claims a ‘defensible’ estimate for landfalling wind speeds of 220-240km/h [are these sustained,or gusts?] by taking the lowest of estimated speeds from a technical brief some 8 hours before landfall. He also extrapolates from data at the damaged Willis Island site 15 hours earlier. Given the 180 degree wind shift he notices almost two hours before the anemometer fails,how can we rely on the figures from that point? Is the barometer reliable? If so,can he provide a means to correlate pressure to generate a wind speed estimate to cross check the recorded figures?
Does this mean he thinks that BOMs preliminary page entry on Yasi as making landfall at marginal Cat 5 [Australian standard],central pressure of ‘around 930hPa measured at Mission beach and Tully’,gusts to 285km/h is indefensible?
At this early stage,should we take Ken as more authoritative than BOM or NASA?
Also worth noting that for unknown reasons Australia uses milder definitions of cyclones than the international standard. A Cat 4 in Australia is by no means a Cat 4 on the official Saffir/Simpson scale.
And what a shame that our weather stations in one of the most cyclone-prone areas of the world fail before winds exceed Cat 1.
Updated,but still preliminary,assessment of Yasi
I notice the qualifying language “Yasi is one of the most powerful…” I do not recall pollies/experts and media expressed it like that.
I look forward to some expert comparison of the damage compared to Tracy – then the BoM Yasi story might not look so correct.
This email went to Jonathan Holmes of ABC Media watch:
There you were, rabbiting on about the iPod technology bringing piccies of devastated banana trees after Yasi …….
The joke is that those trees were cut down by the farmers when they were warned of the coming winds. They harvested what was recoverable – it will go into ripening rooms and be sold cheap in a few months.
We did that when I was a kid in Mackay in the 1940s.
The banana trees put out new axial growth rapidly when cut cleanly at machete swing level. The new crop next year will be better because the organised chop reduced uprooting. Ring the wholesale markets people and ask them.
Did you fail to see that all the trees were broken at the same height in those iPod images?
When will this climate change ignorance end?
When will reporters become accountable?
Geoff Sherrington
Scientist.
Warwick, I dug up these two time lapse animations. The first shows wind speed in the hemisphere, with cyclone Yasi taking a NNW direction from around Fiji.(170E, 15S roughly)
www7320.nrlssc.navy.mil/global_nlom32/navo/WHOSP1_nlomw12930doper.gif
How it manages to cut like an arrow through the previous winds, I do not know.
The second confrms postings above that the sea surface temperatures were not particularly anomalous, either where Yasi formed or off the NE coast of Australia. There could be later temperature animations.
lwf.ncdc.noaa.gov/teleconnections/enso/indicators/sea-temp-anom.php?begmonth=1&begday=1&begyear=2011&endmonth=1&endday=26&endyear=2011&submitted=Animate+Selection
I hope this helps the debate and look forward to a detailed analysis by BoM if and when it comes out.
Correction -NNW is a wrong direction in 30. The bearing was about 250 degrees. Sorry.
the Dangers of Hype by Ken Stewart
kenskingdom.wordpress.com/2011/02/14/the-danger-of-hype/
In other words Yasi was a strong Cat 3 or very low Cat 4, not Cat 5. There is no evidence for winds of 290km/hr . The danger from Cyclone Yasi was exaggerated and over-hyped.
What’s the big deal? you may ask. Lives were saved.
True. Hyping the danger was a good short term tactic and worked. However, this is not a good long term strategy in our fight to defend ourselves from nature’s extremes.
The people of North Queensland may well say, “Well if that was 290 km/hr winds, the damage was bad, but not too bad. We’ll be right next time.”
But the damage from a cyclone with real 290 km/hr winds will be well over a thousand times worse than that caused by Yasi.
Gday Warwick, and thanks (and to Val).
Kandler @ 25: Did you read the JCU statement at
from James Cook University’s Cyclone Testing Station (CTS) team
Any further comments about my estimate?
Ken
Thanks Ken for the link to JCU Cyclone Testing Station article. I see all this exaggeration as an extension of years of lies & exaggeration about rain and drought. We have come to a sorry state when Govts and their experts are sloppy with the truth.
There is no evidence of a cat 5 cyclone anywhere from yasi. You don’t need readings to prove that. There are high levels of recorded damage data from previous events that damage is compared to. example — At about 150 mph light cars start flying. they would have a huge list of old damage reports with these exact sort of details (America uses it to grade tornadoes as well.Well not the same list, but same system)
A cat 5 cyclone would have flattened 1000’s of houses and not just stripped leaves and pushed trees over, it would have ripped the trees from the ground sending them into/through houses. The truth is that anything over 100 mph winds would feel like the world would end with the sound the wind makes and its impossible for anyone in the area to have a clue how strong the wind was.
the BOM lowest pressure reading for willis island was 937.9 and the gauge was working all the way through the eye till the other side.This was at the same time BOM were reporting 922 in there warnings. I noticed soon after they backed it down to 285kmph winds, but it was too late for them to rectify the mistake they had made.. The QLD government and BOM obviously ramped the cyclone up, because this was still a fair way out to sea at willis island.
I understand the need for urgent warnings etc, what i didnt understand is what they gained from it when they could have just said it COULD be cat 5 at landfall. Thats all. Instead of pushing it IS a cat 5 and 295kmph winds all over the media.. Now they have backed themselves in a corner with only a very awkward path ahead and thus have gone quiet on the topic (talking about bligh and BOM)
I will be perusing this in future further due to the importance of historical accounts of events. My views and opinions have nothing to do with the people or suffering and hope that all are doing ok in the area. Its a very sad event and I’m not downplaying the fact it did cause widespread damage. Just the importance of facts and that they belong in records.
If your keen to get something done you can always bombard the Media and BOM with emails asking what happened and can they please set the record straight it.. ohh and ask them to upgrade there weather equipment into the 20th century while your at it ;).
This is a comment from George Walker Professor of Engineering and Science at James Cook University “The myth is that it was a Category 5 Cyclone. The reality is that it was on borderline between a Category 3 and Category 4 in terms of estimated actual windspeeds and the damage they caused, and similar in this respect to several other major cyclones that have hit the Queensland coast in the past 50 years. Its uniqueness was the size of the storm surge, and the large areal extent of the system” Prof. Walker was involved with the assessment of damaged from Cyclone Tracy in Darwin and was a founder of the cyclone testing station for the Australian Building Codes board at JCU Townsville.
Ken,your guesstimate was fine,but done after the event with minimal information.It’s your suggestion that BOM is wrong in an absolute sense or exaggerating that is not supportable. Where were the many ‘alarming reports’ that it was the deepest,rainiest or deadliest cyclone to hit Australia? If that is media over-egging ,then who is surprised? Are you suggesting that any forecast based warnings for Yasi,consistent with presenting it as very large by any standard,potentially very wet,or a grave danger to life,were misdirected?
JCU’s press release shows that their investigation so far does not preclude the possibility that wind gusts were higher than 220km/h,and BOM is obliged to present upper bounds of gust possibility consistent with the pressure readings and internationally standard methodology. As they note, information is subject to post-analysis and may change.
Kandler wrote:
“BOM is obliged to present upper bounds of gust possibility consistent with the pressure readings and internationally standard methodology. As they note, information is subject to post-analysis and may change.
I support Kandler on this.
The central pressure is estimated from the time honoured Dvorak (1975) method, although other methods based (e.g AMSU temperature anomaly) give supporting information. Once central pressure has been estimated, to determine maximum wind and maximum wind gusts, most Tropical Cyclone Warning centres use a direct pressure wind relationship. BOM Perth, as well as the Joint Typhoon Warning Centre (JTWC) uses the Atkinson and Holliday (1975/1977) pressure wind relationship which was incorporated in the revised Dvorak (1984) intensity estimate. My understanding is that Brisbane uses a slightly different scale but it is essentially the Atkinson and Holliday relationship. Only if you have direct observational data from satellite scatterometers or from aircraft reconnaissance would you diverge from that.
BOM estimated the central pressure to be 930hPa at crossing and this seems to be confirmed by two observations of 929 hPa and 930hPa. Operationally there is usually no reliable observational data on maximum wind and therefore the category of the cyclone is based on the estimated central pressure. 929hPa or less (in the Australian region) is a category 5. That relationship is well publicised and has been used for decades. 929/930hpa places the cyclone right at the boundary between cat. 4 and 5. The US scale is different and Yasi would be a cat 4 on the Saffir/Simpson scale. Using the pressure wind relationship the forecast maximum wind gust is >280 km/hr. BOMs forecast of 285 km/hr wind gusts in the advice before landfall is quite consistent.
No doubt re-analysis on the observational data might change the estimates and category particularly since it was only marginally a cat. 5 but that doesn’t mean the operational estimate of intensity was not the best according to the information available. Until satellite or aircraft reconnaissance give detailed real time wind fields, forecasts of maximum winds have to be derived from the central pressure estimate. Aircraft reconnaissance has been used only once for Australian cyclones (Kerry).
In this day and age of computer driven systems, it might appear that you just plug in a Dvorak intensity (or an estimated central pressure) and out comes a forecast max wind gust to 1 decimal place. In fact the Atkinson and Holiday curves had significant variance. Eyeballing the data points which led to the pressure relationship curve at 930hPa gives a prediction of 280 km/hr gusts with a range of something like +/- 50 km/hr. In addition the forward speed ought to be factored in which increases the estimate maximum wind.
The forecast by BOM had nothing to do with hype; I expect the method they are using has been the same for a long time and is in universal use.
For interest, I did a back of the envelope calculation of the estimated gusts using the cyclostrophic wind equation and the information from Willis Island as Ken presented them. The theoretical figure was 245 km/hr gusts, but that assumes the eye was moving directly over the station. If it was not, the figure is higher.
kenskingdom.wordpress.com/2011/02/07/how-strong-was-yasi/#comment-634
Regarding the dramatic pictures of Tracy, you are not really comparing like with like. Building standards have improved markedly since 1975. I remember people saying a really strong sea breeze would be enough to bring down structures in Darwin prior to 1975.
Andrew Bolt referred to this ABC Science program – Ask the Experts, which discusses whether Yasi was a “Super Cyclone”.
One expert said it was a Cat 4, the other that it was the most intense since Innisfail 1918.
In the comments, an Emeritus Prof White points out that www.tropicalstormrisk.com, which specializes in forecasting and tracking tropical storms for industry, never rated it above a Cat 4, even though the ABC were referring to it, both before, during and after, as a Cat 5 with winds up to 300 kph!
This unfortunately is another instance of what sociologists refer to as the “social amplification of risk” or alarmism. We saw it with the swine flu outbreak – “hundreds of thousands might die” and see it daily with the AGW debate, where weather events are hyped up to a public which appears to have little or no memory of the past.
Len of course you are welcome to agree with Kandler.
I am impressed that the JCU Cyclone Testing Station people have said – “The CTS team leader in the field, Dr Geoff Boughton, said that the analysis of damage to simple structures throughout the region indicated that the wind speeds on the ground in Tropical Cyclone Yasi were less than those expected in a Category 5 event.”
So I stand by my headline “Cyclone Yasi has been exaggerated by Govts and beaten up by media” – written on 4 Feb. The Darwin photos were added later.
I am still waiting to see properly surveyed maps and photos of damage.
BOM struggling to find evidence that it was Cat 5, “still going thru the data”?
From SBS Insight on La NinaJENNY BROCKIE: Those houses that stood up quite well were post-1980, and built to category four, yet Yasi was category five.
DR JOHN HOLMES WIND ENGINEER, JDH CONSULTING: The wind speeds were not up to category five level – the winds speeds were up to 220km/h. The designed wind speed is around 250km/h. I spent five days a couple of weeks ago looking at failed road signs. We established from all that, that the wind speeds, at maximum, were 220km/h on the land.
JENNY BROCKIE: Does that mean it wasn’t a category five? I’m just interested if the houses were –
DR JOHN HOLMES: I think it’s very likely it will be downgraded to a category four by the bureau pretty soon. At the moment, it’s still a category five.
JENNY BROCKIE: Scott, do you wont to comment on that?
DR SCOTT POWER BOM: I’m not an expert on these matters, but I have been in contact with Jim Davidson, who leads the bureau’s operations in Queensland. He tells me that Yasi’s currently pencilled in as a marginal category five, but they’re going through the data very carefully, and so we’ll have to wait and see whether it will be confirmed as a marginal category five or not.
Thanks Romanoz – the BoM being gently dragged “kicking and screaming” to accept reality. How the GreenLeft media are so gentle with them.
having survived both Yasi & Larry at Mission Beach
I can asure you ALL ……..that Yasi’s winds were
constant 200kph+ for 45m and …….
gusting 300kph+ for 45m before the eye crossed
we were on top of a 60m hill, on the coast, the solid concrete house was shaking, like a vibrating roller was outside, and the noise ……….
Larry was a picnic compared to Yasi……..
220kph max BULLS**T!!!!
Damage from Yasi was far worst…….
many 10yr old houses deroofed not just the oldies
(google pics of Dunk Island just 4km off Mission)
many private readings of max wind speeds recorded around 300k, but ignored.
Mission had 220kph gusts in Larry, sustained in Yasi was same as Larry’s max +-
People werent that scared in Larry…….however eveyone was scared sh++tless and in genuine fear that they would not make it through!!
Fact, just about every house (25,000 odd) has sustained damage (1000 severe), lost gutterings & water entry, windows & roller doors.
JCU engineers seem to under estimate the max & constant wind speeds, because all the houses havent failed (aka Tracy)……. so the houses designed wind speed hasn’t been exceeded…….so the winds are less than the designed wind speed….?????
A house designed for 150kph wont fly apart at 155kph ……it may with stand 225kph+, …..some will shed bits ……& a single bad or weak tie down = no roof
The BOM projected wind speeds have been deduced from hundreds of cyclones & hurricanes world wide where there has been comprehensive data ( working on bent signs is fine, but they say speed was 55ms L to 80ms H ) so 220 L kph could be 300kph H …..These JCU boffins need to put up wind instruments in the path of cyclones
IF Yasi had hit Cairns or Townsville it wold have been a disaster of New Orleans / Galvston magnitude 100′s of deaths 20,000 destroyed houses etc
“At the time of writing there are no verified observations of the maximum wind gusts near the cyclone centre. However a barograph at the Tully Sugar Mill recorded a minimum pressure of 929 hPa as the eye passed over suggesting wind gusts of about 285 km/h were possible. This is supported by measurements (subject to verification) from instrumentation operated by the Queensland Government (Department of Environment and Resource Management) at Clump Point (near Mission Beach) which recorded a minimum pressure of 930hPa.”
Wind gust can be 40% stronger than constant
When Willis Island failed it was just entering the strongest winds 185k
so we went from gusting 185k ……very quicly
to at 25-30 km to eye a
constant 200kph+ for 45m and …….
gusting 300kph+ for 45m before the eye crossed
then dead calm & stars ……..
then hell again from the North
I was watching the BOM radar on the laptop live from 11pm till the calm
Tracey was in the 70s. Yasi 2000s. Infrastructure in the tropics would have been built stronger by then no?
Thanks for commenting near a decade later – I should pony up a reply later today.
added 19th –
A modern house engineer designed to resist cyclonic winds would be stronger than older houses. But I am not sure that mass produced houses built post 1980 are more robust than houses built say from 1880 to 1950.
It can not be assumed that home buyers will insist on safer homes. Look how communities built in the 19th Century around river crossings have suffered repeated flooding and to this day many people live in flood prone houses.