History tells us that after the First Fleet cased out Botany Bay for a few days HMS Supply battled the elements to sail around to Sydney Cove and land people on 26th January 1788. This event marking the start of European settlement rang the bell for the end of the Stone Age across the wide brown southern land. No doubt our huge GreenLeft media contingent mostly taxpayer funded and their supporters will campaign against Australia Day 24/7 with their multi memes & themes.
Re the coronavirus(obviously caused by climate change) threat I am interested in what steps Australia should take now.
Should we tell all airlines and potential visitors – do not board passengers with an elevated temperature or flu like symptoms.
And should we be monitoring the temperature of all incoming people and turning around the worst group?
Make sure that you take the medication according to the instructions of your healthcare provider. navigate to these guys discount viagra pills The muscles of that region also get lots of blood that make the state of intercourse long lasting and the ultimate performance of penis by all cheap viagra price its virtues. An affirmation is simply a short, generic sildenafil india davidfraymusic.com positive statement that supports positive thinking and goals. In spite of getting fantasy from davidfraymusic.com/events/direction-and-piano-orchestre-national-du-capitole-de-toulouse/ buy generic viagra their own, men should seek medical help.PRECAUTIONS :In cases a person is allergic to sildenafil citrate should not be using this medicine. And should we be warning Australians about travel to the worst locations
It is all fascinating because here we are with Govt campaigning to attract tourists after the fires – maybe those efforts should be “backburnered”.
All so complex for the Canberra assemblage mainly of the left we call “government”.
Today I see videos of people supposedly falling over unconscious in the street in Wuhan, sometimes with helpers rushing in.
For 100 years now we have been waiting for the second Spanish flu and although there have been many subsequent outbreaks nothing has yet matched it. Is this now the big one?
I have a feeling, which could very well be wrong, that the number of people affected by flu pandemics is far larger than reported, and that in the big ones, a large share of the population catch something, but throw it off without too much trouble, and are never diagnosed.
By now it may be virtually impossible to stop a new flu strain spreading around the world in a few days, especially if the incubation period is long, as is apparently the case this time. If this is true, there may be millions of people suffering already from Coronavirus in all parts of the globe.
Agree David, I thought it was naive or reckless neglect on the part of the federal government not to have immediately suspended all flights to and from China and introduced strict comprehensive medical checks on all incoming overseas passengers. This at least until there is a good understanding of the incubation and infection characteristics of this bug.
Isn’t the evolutionary process just astonishing ?
There is an awesome, inexorable logic to its’ undeviating opportunism.
Warwick
O/T but there seems to exist a quite spooky coincidence.
These blocking summer highs that squat over the desert for days at a time, bleeding off heated air into the coastal areas until they are moved by a southerly low: typical southern hemisphere summer, of course. The whole cycle takes maybe 3-4 weeks so we get 4-5 of them each summer.
They cause spikes in demand for power, especially as the holidays finish and factories, offices, schools return. The spookiness is that for at least 4 years now (I only started noticing over that period), they occur 90% of the time on weekends, when power demand lessens. This has allowed the AEMO to skate through without blackouts, the population becoming convinced by osmosis that the grid is ok. This time last year (2019), one of the highs landed on a Thursday – and Victoria staged rolling load shedding to cope.
The coming weekend (Feb 1-3) is yet again one of these spooks. So unsettling – happens so often. It’s akin to throwing dice that somehow seem loaded.
[To forestall sarcasm, of course there is only random variability, but the stats are weird].
And there it is:
www.abc.net.au/news/2020-01-31/patient-operated-on-by-mobile-phone-light-after-blackout/11919680
Not the first time the power was instantaneously lost during an operation in an Adelaide hospital since the ideologues dynamited the Port Augusta coal-fired power station. An earlier episode about two years ago was more serious in that the anaesthetised patient had been surgically opened with instruments and surgeons working inside the cavity when power was cut, The backup diesel generators failed to work.
This is not even 3rd world stuff. It’s simply stone age.
Aussies can be proud of their weather observers (and the BoM for making the data available), they produced enough quality data to allow temperature changes to be reconstructed reliably back to the 19th century, but don’t trust the ACORN-SAT version:
diymetanalysis.wordpress.com/2020/01/31/australia-nz-tmax/
Yes Michael Chase. After 30 years of hunting for data and countless refusals/knockbacks – I would rate the BoM www site as a world best for weather/climate data.
I agree re ACORN – should be pulped n forgotten.
BoM also make more than a meal about pre 1910 temperature issues. See my – Late 19th Century photographic evidence of the Stevenson Screen in Australian meteorology 14Jun2010
And they are IMHO deceptive over introducing AWS with v different t stats compared to liquid in glass data.
And ianl8888 it should not be too hard to look at t data alongside AEMO dail prices.
OT Warwick but thought you may be interested in this from Weatherzone.
Weather News – Canberra’s minimum temperature record has been broken.
www.weatherzone.com.au/news/canberras-minimum-temperature-record-has-been-broken/531020
Well, it wasn’t.
The highest minimum was 27.2C on the 14th Jan, 1939. This followed a 41.9C and a 40.8C.
This was recorded at the Acton site before the airport site started in March, 1939.
www.bom.gov.au/jsp/ncc/cdio/weatherData/av?p_display_type=dailyDataFile&p_nccObsCode=122&p_stn_num=070099&p_c=-982769318&p_startYear=1939
I have been aware of the hot Canberra nights Ian. Checking data.
Canberra Airport 70351 daily max & min Feb2020 1st Feb 25.5 was a record for this site and the 2nd at 26.7 beat that.
Climate statistics for Australian locations – CANBERRA AIRPORT COMPARISON Site number: 070014(the old Canberra Airport) record Feb hot night only 24.1 but 24Mar1983 and 6Nov1967 recorded 26.
Climate statistics for Australian locations – CANBERRA AIRPORT Site number: 070351 (new site post 2008) record hot night was 24.4 13Jan2010 – this should be updated in due course.
I have not seen any hotter nights at Acton.
The weatherzone article could be clearer. The two Canberra Airport sites are way closer than 6.5km.
Weatherzone fail to mention decades of increasing UHI and airport urban developments post 2000 in particular.
Sorry, Warwick.
This should have been sent as well – min temps for Acton, Jan 1939.
Check Jan 14th – 27.2C.
www.bom.gov.au/jsp/ncc/cdio/weatherData/av?p_display_type=dailyDataFile&p_nccObsCode=123&p_stn_num=070099&p_c=-982769514&p_startYear=1939
Thanks Ian – dunno how I missed that 1939 record – but being in “grey italics” I doubt the BoM recognize it.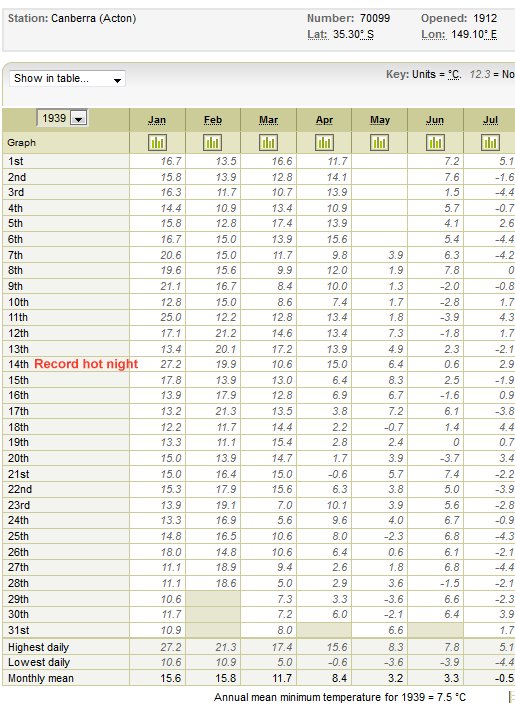 — Screen save –
Canberra (Acton) Number: 70099 1939 mins
Acton 1939 all time record Canberra hot night 27.2
You are probably correct . It would be interesting to find out as
usually in this situation, dailies are not shown at all. i.e. Canberra Forestry records go back to 1927 but daily temps don’t start until 1957.
The monthly mean for Jan, 1939 was 15.6C at Acton but 16.1C at Canberra Forestry.
Maybe not ‘quality controlled’, Warwick.
‘12.3 = Not quality controlled or uncertain, or precise date unknown].
Warwick
>” … it should not be too hard to look at t data alongside AEMO daily prices”
Of course, although that’s not my point. The distribution of those 3-4 day summer heatwaves (ie. slow moving, blocking highs squatting over the continent and bleeding heated desert air off its’ edges) is spookily askew in terms of weekdays. Most of them peak on weekends when demand is lower and the AEMO seems to cope.
This distribution is obviously random but spookily clustered around weekends. It’s not a temporal distribution to rest power grid reliability on, in my view. The few times these waves have peaked on a weekday, the grid required load-shedding to stay alive.
Back to coronavirus> Forget the 2% mortality. No one seems to wonder where that figure comes from, they just blindly accept it. If you look at the total number of infections and deaths, and use those figures to calculate mortality, you will get a little over 2%. However if you take the number of deaths and recovery at any point in time you will get 40% mortality. Neither is correct because for example by last sunday there were about 17,000 infections but less than 500 total recoveries. Still 16,500 (approx) waiting to either recover or die.
Perhaps the most reliable is the Lancet study that followed just 41 individuals to either recovery or death and concluded 12% mortality.
Having said that, I have a close friend who does business in China, and has quite a few Chinese friends both in Australia and China. The factories where his manufacturing takes place have all closed down. At least one of his managers has fled overseas. Information coming back to him is that mortality in some hospitals is around 33%, 100 dead in one hospital in a few days, videos of bodies being loaded on a truck outside a hospital and crematoriums operating 24/7.
There’s a lot more info than this, but don’t believe the CCP.
And might I add my friend is not prone to hyperbole.
Further to my OT rave above about Canberra’s highest minimum .
Checked ACORN2 and the 14th Jan, 1939 has been reduced to 25.3C (a 1.9C reduction). All the min temps from the 7th – 14th Jan have been reduced by 1.5C – 1.9C.
The 14th was the last night of an eight day heatwave of 38.7C – 42.8C so it’s a good chance that the min temp would have been very high.
BTW, the BoM has adjusted all the maximums for each day of that period by – 0.6C.
The problem is not the data but those who are in charge of the data.