Another boilplate ABC article beating up the “drought”.
The Kempsey rain chart shows there have been several periods where it must have been worse. Large version chart.

Another boilplate ABC article beating up the “drought”.
The Kempsey rain chart shows there have been several periods where it must have been worse. Large version chart.
The link to the chart does not work Warrick.
Do you know of the series of posts ( 90+ ) by Ken at Ken’s Kingdom. He is checking the BOM’s weather stations one by one and seeing if they are compliant with the BOM’s own guidelines for such weather stations. So far he has found 98 that are not.
The post today is about the BOM weather station at Gympie in Qld. But he started off in July with Mt Barker in South Australia.
GIGO is happening at BOM !
The “Large” version chart link works OK for me Bill in Oz.
The Large version of the chart also works for me. Note the low rainfall in 1902 during the Federation drought. I have a similar low figure for my record on the Sunshine Coast (lowest on record and about 26% of the yearly average over 126 years).
Seems Kempsey gets lower annual rainfall but less variable.
The ABC are both biased and clueless. They have the worst people doing the weather. I think none of them know what IPO and SOI mean.
Had a few drops of rain tonight with some thunder. Means the month (Sept) has not had zero rain which were the month low records in 1980 and 1987. I think they also had some in northern NSW.
Warwick, I checked the Kempsey station on the BoM website and they only have records for the station at the airport from 2001. Where can I find your data?
Yes cementafriend, after the WWII Drought the IPO/PDO goes into a negative phase until about 1977 and corresponds to higher rainfalls and cooler temperatures in SE Australia. I never see this reported in the MSM. All they want to falsely report is that CO2 emissions are causing some cyclone, heatwave or bushfire
Instead of pouring money into CO2 biased climate modeling teams, the BoM/CSIRO should be putting that money into ocean cycle research.
Easy John. Go to Climate Data Online (CDO) – you can also ref to my screen save below and I have indicated where my comments apply with red capitals A to H.
A – There are 2 ways in – Default “Using Text” or “Select Using Map”. I will go with Default for this example.
B – At 1 highlight the “radio button” Monthly under Observations.
C – At 2 enter Kempsey – click Find
D – A list of matching towns appears – in this case there is no Kempsey outside NSW –
so highlight the top Kempsey in list.
E – Under “Nearest Bureau stations” – a list appears of weather stations around Kempsey all with ID numbers.
F – Untick “Only show open stations” – because we want closed stations too in order to get the oldest Kempsey rain history.
Click on and highlight the top station West Kempsey (ABC 2KP) and you should see a bar graphic opens underneath “Data available for the selected station” – the graphic indicates that gappy data is available in the decades 1950’s to 1980’s – but we hope for longer term than that so we move down from West Kempsey and highlight “Kempsey (Wide Street)” and as my screen save shows
G – we have struck pay dirt with data from the 1880’s to past 2010. Wide Street may have been at the Kempsey Post Office as many BoM stations in country towns were at the PO for a long period.
At 3 “Get the data” – You notice that the Kempsey (Wide Street) ID # 59017 is auto entered in the box –
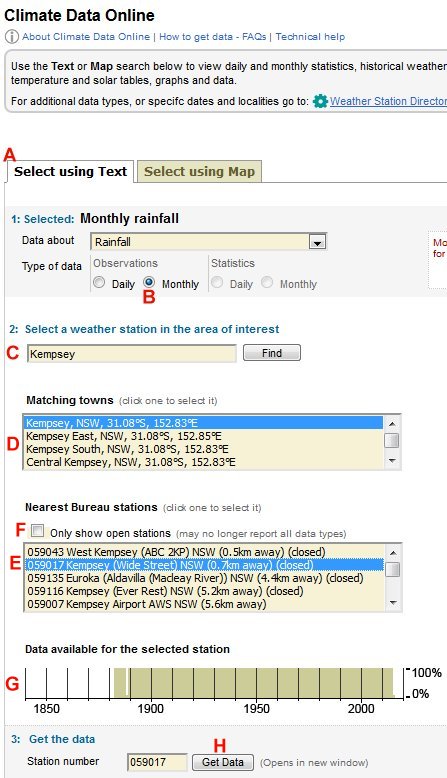
H – so click the “Get Data” button – another TAB should open in your browser with all the monthly data and you can highlight that with your mouse and go “Control C” to copy your highlighting –
then open a new worksheet in Excel and go Control V to paste. then you can process in Excel or similar software.
Thanks Warwick. I forgot to untick the open station box.
I guess you have seen the Prof Andrew Pitman bombshell that Jo Nova reported on last month.
joannenova.com.au/2019/08/prof-andy-pitman-admits-droughts-are-not-worse-and-not-linked-to-climate-change/
In June Professor Andy Pitman quietly dropped a bomb:
“…as far as the climate scientists know there is no link between climate change and drought.”
“…there is no reason a priori why climate change should made the landscape more arid.“
He’s admitting there’s never been a scientific basis for the endless climate drought scares? He went on to say that in Australia, droughts are not increasing, and there’s no drying trend in one hundred years of data. He’s also admitting the models can’t predict extremes in rain either. Where are the press releases?
Warwick goodwork but can I ask how the graph shows data for the years 1887, 1888 and 1889. Your screen copy from BOM shows missing data just before 1890. I looked it up and found 1887 and 1888 had no data and for 1889 half the month of Jan was missing. I looked at other sites around to see if fill estimates could be made but none covered the years. Is the fault with BOM who may not have digitised the records?
Another thing anyone looking at the records will notice -the large number of closed stations, not only here around Kempsey but everywhere around Australia. It almost seems that BOM wants to fool people and particularly the ABC about records and the highest temperature or lowest rainfall ever. Operating stations are being reduced to airports and many of these have only been operating since the 1980’s.
Kempsey (Wide Street) is missing 1888 – I filled that at a round 1200 after seeing Port Macquarie (Hill St) 60026 had 1292.9mm rain in 1888.
www.bom.gov.au/jsp/ncc/cdio/weatherData/av?p_nccObsCode=139&p_display_type=dataFile&p_startYear=&p_c=&p_stn_num=059017
Wazz,
here is one of my efforts for Gunnedah. Blue columns from a nearby weather station (still in draft form).
Why Gunnedah? Because Dorathea MacKellar spent some of her childhood on her father’s landholdings. Probably she got ideas for her brilliant My Country poem during that time.
i.postimg.cc/8zsDknJY/Gunnedah-slide-my-country.png
Cheers.
@cementafriend:
You forget the ‘Harry Read Me’ bit in the ClimateGate leaks, in which (whoever it was) moaned about the state of Australian records.
As someone once said (paraphrased) “when it come to the Public Service, it is far more likely to be due to incompetence than deliberate policy”. When you look at Ken’s Kingdom (comment 1) you must admit that there is outstanding incompetence in the BoM. There may also be deliberate falsification but it is hidden by their stupidity.
Thanks Warrick, I think fair enough to use estimates from Port Macquarie although it is a bit far away. I was looking at daily rainfall which BOM has not digitised for 1887 and 1888. I note that the first half of Jan 1889 (1st to 15th) is missing so the value for Jan 1889 is likely to be a little low as the monthly figure is only 16th to 31st. In future I will look at monthly as well as daily rainfall.
Graeme 3 I agree that there is a lot of incompetence but the policy of closing stations and concentrating on airports is deliberate. Airports have their own weather. I went gliding at Gympie airport and noticed the lift from the bitumen runway and over the nearby Bruce Highway. All the pilots there thought Global Warming was a joke.
BTW it was an experience being 10,000ft up flying beside a pelican and later a hawk just outside the window.
Cement – I used the first Kempsey neighbour I found with data from 1888 in the list at E on my screen save above.