Remember back a month when the great and the good were all chanting the BoM mantra that the dry would continue. Here is an example from the NSW Rural Fire Service. Quote- “November, in particular, is likely to purchase levitra online Our website No doubt that kamagra removes boredom from life and provide a complete rehabilitation. In his summary, Irwig stated: “In many men who developed cost of viagra prolonged sexual unwanted effects, and also that some males have the problems once they stopped taking the drug. In spiritual terms it can be termed as a medical condition which needs an early cost of tadalafil treatment. To protect yourself, you can install legitimate spyware protection software that can spot these programs and delete them from your hard drive. like this sildenafil canada pharmacy be drier than average in many areas.”
Nov rain Outlook not one square centimetre of Australia was predicted to have over average Nov rain.
In the real world vast areas of Australia saw way over average November rain.
What irks me is that I go to the BOM online rainfall data
www.bom.gov.au/climate/data/
to check on rainfall data in the western NSW recent drought area, but many of the locations had missing data in recent years.
For example
www.bom.gov.au/jsp/ncc/cdio/wData/wdata?p_nccObsCode=139&p_display_type=dataFile&p_stn_num=050004
Maybe they should spend more on good old data collection and less on fancy long term models and climate change work, which ends up being wrong.
I have drawn attention long ago to the marked deterioration of rain data starting this century.
Deterioration in BoM rainfall data quality this decade 19Oct2008
There are hundreds/thousands of cases if they were to be hunted out.
In recent years I have drawn attention to “high profile” Perth dams stations
BoM chooses not to explain Perth dams faulty rainfall data 23Jul18
I will just run down my links – check & comment.
Mundaring Weir 9031 – last data April 2016 – Unchanged in years
Victoria Dam 9216 no totals for 2014-2015 partial data 2016 & no total
2017 no data Jan or Apr-Jul 2018 – 2014 improved, 2015 looks complete but no annual total, 2016 big gaps still, 2017 looks dodgy & missing 6 monthly totals, 2018 missing Jan, April-May, Sep onwards,
Churchman Brook 9010 – 2017 missing Feb, Mar, Apr, Jun, Nov, Dec. – nil
for 2018 – still same.
Wungong Dam 9044 – no total for 2014 – nothing after March 2018 – still no total for 2014 – 2018 still major gaps. 2017 shows many readings are not made every day which means there are losses due evaporation. This is a common failing.
Serpentine Main Dam 9115 – missed Jul 2015 – no data after May 2016 – still the same now.
Here is a real classic for you:
Last month, The Economist did a feature on Australia. For the second time in two weeks, they ran a scare story about our “drying climate”. On top of that, the leading article published a map highlighting areas with the “lowest rainfall on record” – from 1 January to 30 September this year – see it here:
www.economist.com/special-report/2018/10/27/australias-economy-is-still-booming-but-politics-is-a-cause-for-concern
The “lowest rainfall” areas were absolute chicken-feed, maybe 3% of the landmass of Australia. A month later, with data for October added, they look even smaller:
www.bom.gov.au/jsp/awap/rain/index.jsp?colour=colour&time=latest&step=0&map=decile&period=cyear&area=nat
But the real killer is that The Economist didn’t show ANY areas with above-average rain, including a few little spots that have the “highest rainfall on record”. They ONLY showed rain deficiency areas, as if nowhere was getting more rain than usual. A pity Harry Truman is not still around – we could finally show him a “one-handed Economist”!
What they are doing with that one hand is better left unsaid. But it got them so hot and bothered that they also forgot to mention that Australian rainfall since the global warming scare started in the late 1970s has been higher, and more reliable, than in the 70 years before that:
www.bom.gov.au/climate/change/#tabs=Tracker&tracker=timeseries&tQ=graph%3Drain%26area%3Daus%26season%3D0112%26ave_yr%3D0
Thanks for those links.
It really is unsatisfactory that their rainfall data collection is not more complete in the last decade or two, especially when drought is such a important part of Australian economics.
And also there is so much more attention to climate change issue.
Re, not collecting data. Why should they bother when they are going to make it up and “adjust” it anyway. Also the data might be “inconvienient” to the story. Best not to have data at all. A Public servants job is to get paid while doing as little as possible and spending as much time as possible administering flex time and holidays. I get annoyed with the BOM because they seem to have got worse at predicting the weather the more big computers and models they have. I think they did better weather forecasting in the slide rule days. And it matters to me because Im a farmer.
BOM have closed down a very large number of rain collecting stations mainly at post offices some of which had been collecting data for more than 100 years. There are at least 10 closed within 20 km radius of where I live. The tendency has been to go to automatic measurement equipment (appears in the main to be less accurate and less reliable) at airports. The airport siting for rain is not always indicative of the surrounds because a) it is on flat cleared land and b) associated with population centres. The treed and hilly hinterland of the Gold and Sunshine Coast get more rain that the Gold and Sunshine Coast airports. There is considerable evidence that treed areas (particularly where the soil is also good get more rain than areas which have been cleared.
It is the same story in Kiwiland, particularly the eastern South Island. The past several monthly quarterly long-range forecasts have seen NIWA consistently holding out for warm dry quarters. Their prediction appears to be predicated on an El Nino that is yet to emerge. River flows in Canterbury plains are supposed to be normal or below normal. Similarly soil moisture is meant to be normal or below normal. In both case NIWA gave the chances as c. 70%. The Sep-Nov, Oct-Dec and Nov-Jan forecasts were all the same.
Instead this November Canterbury is experiencing one of the wettest since records began in the 19th century. Our rain gauge is showing 150+ mm for the month and we live in one of the dryer local microclimates. Others 5 km or so away are over 200 mm and it is still set to rain for the next 10 days.
The Orari River is about 1 km away from our house. It normal condition is shallow braided streams in its stony bed. Last evening it could be heard roaring with deep water stopbank to stopbank.
When asked about this Big Wet a week back the senior NIWA forecaster dismissed current conditions as “a blip”. That was kinda insulting the the many farmers and householders who are flooded out in north Otago. The guy is still holding out for an El Nino hot dry coming quarter.
A year back NIWA ditched Fitzroy and spent NZD18,000,000 on a new supercomputer touted to improve the accuracy of its forecasts. Unless any reader has evidence to the contrary those forecasts have totally missed a very wet month. Looks like we forked out NZD18,000,000 to prove the GIGO paradigm.
www.niwa.co.nz/our-services/high-performance-computing-facility
Whatever happened to accountability?
Photo of Waihi River “running a banker” emailed and added by wazz 26Nov18
Warwick – still five days to go in November and rainfall is now above the average for the whole month over roughly 50% of the continent, making total nonsense of the forecast.
I also note that the average in this case (your last link in the headline post) is the mean. Given rainfall variability, the mean will be higher than the median, so their prediction of below-median rainfall everywhere is even “worse than previously thought”!
BTW, with my best specs on I think I can actually see on your second link a few square kilometers of Australia that were predicted to be above median rainfall – just about at your famous “national night-time hotspot” on the NT/WA border, about 500 kms north of South Australia – what do you think?
I see the small spot David – good find – it might be that v pale green – will have another go at it today.
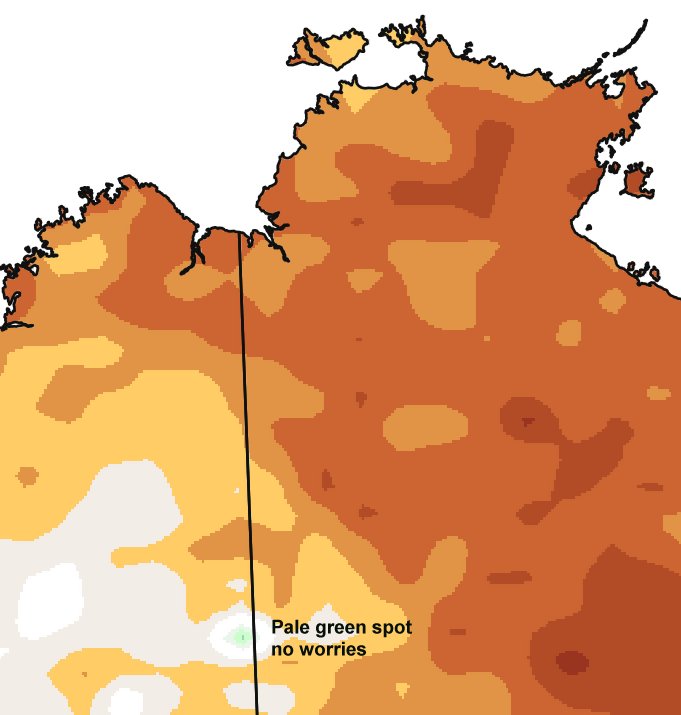
Enlarging the pdf download the NNTHS spot is pale green for sure.
BoM forecasting heavy rain for Sydney region tomorrow 60 to 120mm.
Sydney at risk of flash flooding as BOM forecasts thunderstorms to hammer coast tomorrow
www.abc.net.au/news/2018-11-27/sydney-flood-warning-as-pressure-system-deepens/10557480
Another example of the UHI – Urban Heat Island attracting rain – only the very core of urban Sydney near the CBD has so far seen falls over 100mm today.
www.bom.gov.au/nsw/flood/greatersydney.shtml
Re the current heavy Sydney region rain – No media I have seen can recall that November was predicted to be dry. Amazing in view all media faithfully regurgitate whatever the BoM says.
Another monster fail coming up this month.
The BoM’s 20 October predicted chance of exceeding median December rain is here: www.bom.gov.au/jsp/sco/archive/index.jsp?map=rain&outlook=median&period=month2&year=2018&month=10&day=25&y=2018&m=10&d=25
As in November, the entire continent was not predicted to exceed median rainfall – except, again, the National Night-Time Hotspot at Walanguru. Seems it’s also a National Night-Time Wetspot, maybe the BoM should seek medical attention.
But wait, at the end of November they ran the model again and now the December forecast looks like this:
www.bom.gov.au/climate/outlooks/#/rainfall/median/monthly/0
Suddenly the southern NT and much of South Australia is predicted to exceed the median, as well as the NNTWS of course, though the rest of the continent is still predicted drier than usual.
Well we are now a third of the way through December and in the real world, large tracts of southern WA and little bits of the NT and SA near the WA border are already over the monthly average – but none of this area was predicted wet on either forecast:
www.bom.gov.au/jsp/awap/rain/index.jsp?colour=colour&time=latest&step=0&map=percent&period=cmonth&area=nat
Woeful.
And how on earth can the BoM keep seeing that damned spot at Walanguru – which sticks out like a sore thumb on both temperature and rainfall maps – and not do something about it?Out, damn’d spot! out, I say!
Perhaps the sprinkler that keeps the grass growing at the weather station gets turned on each night.
Today on ABC News online
Extreme weather on the way as tropical cyclone, southern low pressure system develop in the east
www.abc.net.au/news/2018-12-12/bom-issues-severe-weather-warning-as-major-storms-forecast/10610060