The AEMO daily price for 18Jan18 for South Australia was $1,074 per MWhr which was the highest since $1,492.16 on 8Feb17 no surprise there. But Victoria yesterday recorded a stunning $905.22 which is 4.6 times the previous highest of $195.67 on 10Feb17. You can toggle between SA & Vic at this AEMO page and also choose between 30min and 5min price views. Then the NEM Dispatch Overview.
This record Vic price clearly reflects reduced generation post the closure of Hazelwood.
A couple of charts from the GridPublicKnowledge www pages for SA and Vic gives an idea what was happening yesterday with our stressed power grid. NemWatch gives a snapshot of generation sources.

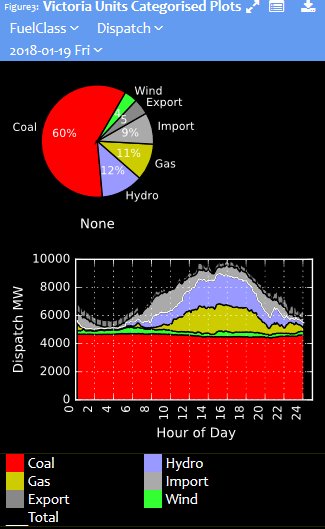
and Vic

I also kept the SA screen for the 17th. Similar heat is forecast for Adelaide and Melbourne today but a late cool change is due which should be earliest in SA. I understand this heat is moving into NSW and Penrith has 40 forecast for today through to Monday. Will try and follow the effect of this on the NEM.
My GridPublicKnowledge links to SA and Vic seem dead.
You could try pasting these to your URL bar – the site is slow to open – have a coffee and it might have arrived.
grid.publicknowledge.com.au/WS/page.htm?Req=%5BTp=Inst;Sel=%5BTp=LC;Cls=C_State;IG=%5BTp=Thing;IId=173;NM=South_Australia%5D%5D;Area=AspectTabs%5D
grid.publicknowledge.com.au/WS/page.htm?Req=%5BTp=Inst;Sel=%5BTp=LC;Cls=C_State;IG=%5BTp=Thing;IId=173;NM=Victoria%5D%5D;Area=AspectTabs%5D
Notice how:
1. When, around 4 pm, South Australia starts approaching “peak demand”, they need to resort to “liquid fuel”, i.e. diesel generators, to keep the lights on.
2. In South Australia, but especially in Victoria, wind power drops off sharply just when you need it through the afternoon and early evening peak. At those times, wind is only supplying about 10 per cent of demand in SA and less than 5 per cent in Victoria.
Astonishing that we have the technology to follow almost in real time exactly how we are being screwed over and endangered by crazy wind power policies, but lack the brains to go back to sensible electricity management.
Following the heatwave – charts for Friday 19Jan18
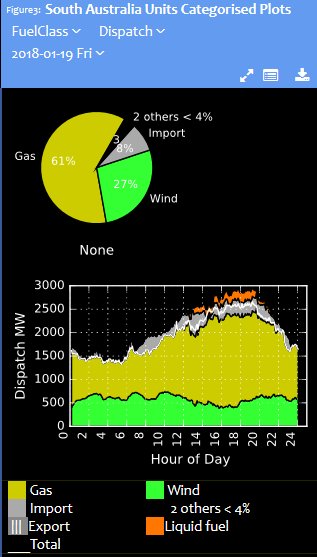
SA note AEMO av price for SA on the 19th was $1,011.67 still over the $G. Love that Labor at work.
Vic note AEMO av price for Vic on the 19th was $522.66 after the $905.22 on the 18th – still YUGE.
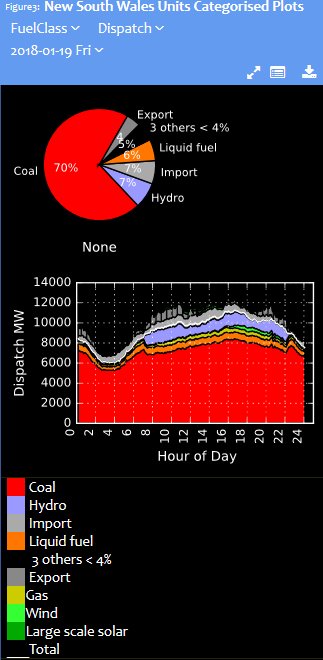
NSW
Nem Watch (reneweconomy.com.au/nem-watch/) seems to be just spinning its’ wheels, refusing to load, although it has been ok for some years up to now.
Given the silly windmills and moonbeams partisanship of this website’s author (Giles Parkinson), I am entitled to wonder if the site is now deliberately spiked to prevent data on the current mess actually being viewed.
Same here ianl8888 NemWatch has not revealed itself over the weekend.
“The numbers for mid-day 21 January:
• Total grid load: 24,000 MW.
• Wind production: 300 MW, (1.25%) – (SA produced zero).
• Hydro production: 1,400 MW, (5.5 %)
• Coal and gas production: 22,300 MW, (93.25%)”
(from Catallaxy)
In my view, there seems no doubt our Mr Parkinson is deliberately censoring accurate NEM data, keeping it out of the public gaze, likely in order to promote later disinformation.
I genuinely expected something like this. There will probably come a point where temperature records will be declared classified under national security. The climate alarmists are right – there is a tipping point … we’ve reached it, just not the one they’ve been pushing.
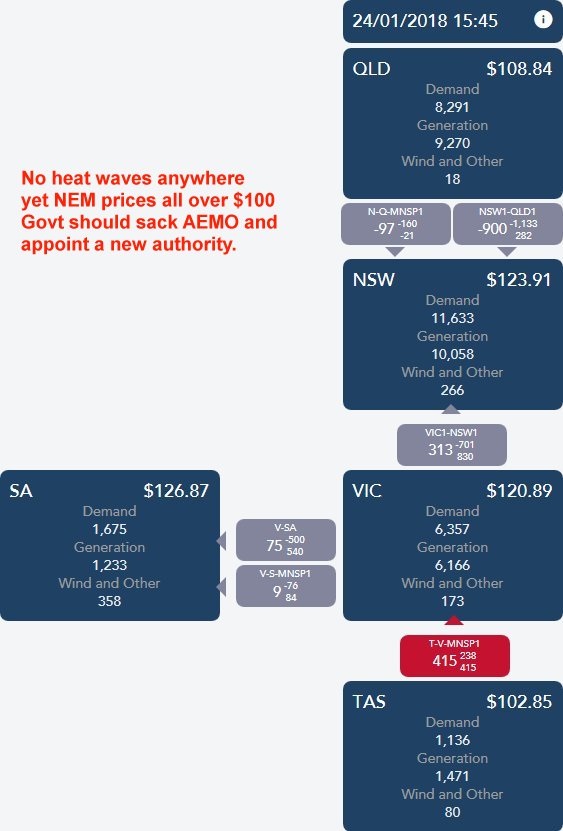
Why are prices all over $100 today?
So there were blackouts in Adelaide on the 19th.
www.adelaidenow.com.au/news/south-australia/soaring-heat-across-south-australia-followed-by-thunderstorm-warning-prompts-energy-warning/news-story/1af45ff55f37bf87aa505d987a7357cc