How bizarre is this – heavy rain and floods starting 9/10 Feb – but no Feb 2017 rain recorded yet – while rain is so easy to measure and record.
[1] BoM station Mundaring Weir 9031 has no data later than March 2016
[2] BoM station Victoria Dam 9216 is missing March and Jun, Oct to Dec 2016 nothing yet for 2017
[3] BoM station Churchman Brook 9010 has many periods in 2016 where no daily readings were taken – arrows. And no data yet for 2017
[4] BoM station Wungong Dam 9044 has all months for 2016 now and Jan 2017 as well(applause).
[5] BoM station Serpentine Main Dam 9115 has nothing after May 2016 – nothing for 2017 yet.
Can anybody recall anything like this tardy recording by the BoM anywhere else?
The rain that caused the floods from around York and Northam we saw on TV news was mostly from 9 Feb to 11 Feb and left this broad band of 100mm+ rain from Perth SW into the wheatbelt.

No time to read and record rain gauges when everyone at BoM is so busy homogenising.
The written word can be embarrassing – far better to update it when the desired results are known:)
Cheers
Roger
www.thedemiseofchristchurch.com
According to the Water Corporation stream flows into dams is only 7% of water supply. That is shocking.
www.watercorporation.com.au/water-supply/rainfall-and-dams/sources
They also say,
‘The water in our dams is no longer just made up of inflows from rain. Groundwater and desalinated water are stored in these dams during periods of low demand so it is available when it is most needed in the hotter months.’
Annual evaporation around here is 1.8 meters per annum. A rough calculation says evaporation exceeds stream inflow and therefore Perth dams provide a less than zero supply after subtracting evaporation of desal and ground water stored there.
Something is seriously wrong.
I just checked a couple of stations in Brisbane, Sydney & Melbourne catchments and all were normally up to date till today. What is it about Perth?
Someone needs to drain the swamp at BOM. They can not forecast correctly beyond three days, they can not measure temperature and rainfall correctly, they have no idea about errors and error ranges, they do not understand statistics, they do not understand computer networking and they can not run properly their supercomputer which cost millions.
Fifteen year old school kids (who have not been brainwashed with AGW crap) could do better.
I know:
Insurance companies will mostly only pay flood insurance claims for flooding where water comes down.
If it comes up or magically appears they are “good to go” taking your money & stonewalling claims.
Gotta love fine print. /sarc.
Agree Bg – I just grabbed these – all as you would expect.
Brisbane catchment
ESK POST OFFICE (040075) 2016 complete and data to 20 Feb 2017
www.bom.gov.au/jsp/ncc/cdio/weatherData/av?p_nccObsCode=136&p_display_type=dailyDataFile&p_startYear=&p_c=&p_stn_num=040075
WIVENHOE DAM (040763) 2016 complete and data to 20 Feb 2017
www.bom.gov.au/jsp/ncc/cdio/weatherData/av?p_nccObsCode=136&p_display_type=dailyDataFile&p_startYear=&p_c=&p_stn_num=040763
Sydney catchment
HIGH RANGE AWS (WANGANDERRY) (068262) 2016 complete and data to 21 Feb 2017
www.bom.gov.au/jsp/ncc/cdio/weatherData/av?p_nccObsCode=136&p_display_type=dailyDataFile&p_startYear=&p_c=&p_stn_num=068262
TARALGA POST OFFICE (070080) 2016 complete and data to 21 Feb 2017
www.bom.gov.au/jsp/ncc/cdio/weatherData/av?p_nccObsCode=136&p_display_type=dailyDataFile&p_startYear=&p_c=&p_stn_num=070080
Melbourne catchment
MOUNT USEFUL (085021) 2016 complete and data to 21 Feb 2017
www.bom.gov.au/jsp/ncc/cdio/weatherData/av?p_nccObsCode=136&p_display_type=dailyDataFile&p_startYear=&p_c=&p_stn_num=085021
MURDERERS HILL (085289) 2016 complete and data to 21 Feb 2017
www.bom.gov.au/jsp/ncc/cdio/weatherData/av?p_nccObsCode=136&p_display_type=dailyDataFile&p_startYear=&p_c=&p_stn_num=085289
I’m sure that they will claim, lack of funding.
Warwick, this was my back of an envelope calculation.
Serpentine dam area 10.67 sq km
Evaporation 1.8 Meters per annum
Dam evaporation 10.67 X 1.8 = 19.2 million cubic meters = 19.2 gigalitres (at maximum capacity)
Assume filled to approx half max surface area = 10 gigalitres evaporation approx
Perth water supply 300 gigalitres
Assume other dams are equivalent to 6 times area of Serpentine.
Total dam evaporation = 60 gigalitres
Stream inflow is 7% of supply, hence 21 gigalitres (ignoring evaporation)
Hence dam evaporation about 3 times stream inflow.
You have to wonder why we even bother with dams if the Water Corporation is right about stream inflows, and with their policy of storing desal and groundwater in dams. Surely a better approach is to make groundwater and desal more on demand, which should be easy for groundwater at least.
Agree Philip it seems odd to pump desal water up into dams where evaporation and no doubt other issues due to catchment mis-management takes a toll.
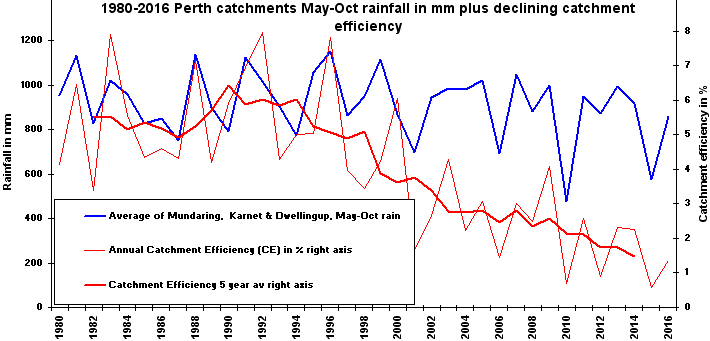
I have just updated my catchment calculations that gives me my chart of catchment efficiency. Larger copy.
Water Corp on their website said inflows were 40.9GL last year (I assume that is May to Oct) I kept the 1 Nov screen. However inflows continued after that and on 4 Jan they were 47.1 which I assume was the 2016 total. But for consistency I use the 40.9 May-Oct figure for my chart.
Total rain over the 3,500 sq km of catchments was 3002.3GL – 40.9 inflows is 1.36% a disgraceful figure for any water utility under these conditions.
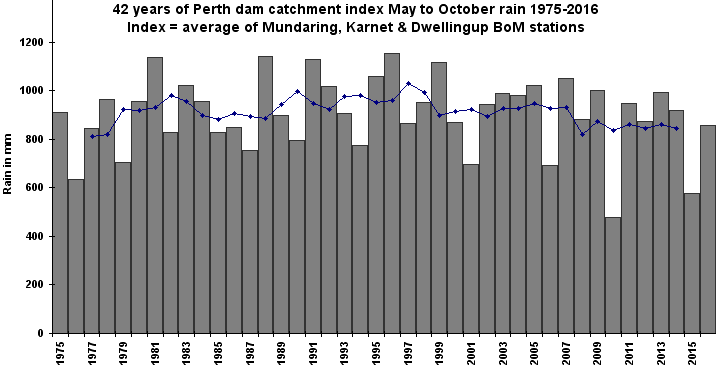
My 1975-2016 catchments rain chart.
On the basis that 100mm fell on Perth catchments – that is 350GL just in the 2 or 3 Feb days.
According to BoM rainfall decile map, Perth and several other spots in southwest WA had the highest February rainfall on record last month:
www.bom.gov.au/jsp/awap/rain/index.jsp?colour=colour&time=latest&step=0&map=decile&period=month&area=wa
…which is rather odd after the Climate Council told us six years ago that:
“Rainfall patterns in Western Australia have changed over the last 40 years. There is significant evidence that climate change has contributed to the marked drying trend in the southwest of the state…
“There is strong evidence in southwest Western Australia
that climate change is making a significant contribution
to the drying trend…
“The drying trend has important consequences for the
Western Australian wheatbelt. By 2050, changing rainfall and higher temperatures could result in yield losses of more than 30% (van Gool 2009)”
www.climatecouncil.org.au/uploads/e0d4e50478b96d1a50c821b7b2c022a4.pdf
Still not a mm rain recorded for Feb 2017 at your stations above. Too mad.