The BoM blah-blahs on – Every station in the metropolitan area recorded its highest January mean temperature on record and most stations (including Sydney Observatory Hill) also broke records for mean maximum and minimum temperatures.
Not a word on the above BoM page of the ever growing urban heat island driving temperatures hotter for 150 years.
I see Richmond RAAF 67105 had Jan 2017 mean max = 34.1, mean min = 20.
I only have to check historic monthly mean max and min for Richmond – UWS Hawkesbury 67021 to find that 1946 equalled the Jan 2017 max of 34.1 and smashed the min by a whole degree. So obviously all the BoM claims for last month are rendered so pathetically tenous and lineball (without plugging in a “correction for UHI”) – what a disgusting propagandist organization the BoM has become.
How shameless are the BoM, media safely in their hands. Nobody would speak outside the meme.
A bit O/T I know but worth ducking over to www.weatherbell.com/ and having a look at Joe Bastardi’saturday summary. 5 minutes. He spends a bit of time on NOAA’s global temp claims.
My base degree is Chemistry.
I have directly undertaken research on numerous topics.
I, nor my compatriots have never fudged data.
The current practice of modifying raw weather data is disgusting, immoral and absolutely unethical.
Yet we have professional people all over the world now regarding this as totally acceptable.
What is the difference between this and falsifying a signature on a cheque?
Both practices are equally criminal.
In Australia, the Weather Bureau and the CSIRO used to be magnificent organisations.
But time passes me by.
Also interesting to note re Sydney’s max mean record.
It beat 1896’s record by 0.1C. However, if you look at the data, the 19th Jan, 1896 was not recorded so, although 2017 is officially a record, noone can be really sure.
BTW, despite it being a very hot Jan in NSW, it could not beat 1932 or 1939. I wonder what 1896 would have been like?
Record grain harvest in the West, despite widespread frost damage. I think I mentioned earlier that I was talking to farmer from near Wagin (generally considered the prime wheat growing area) who lost his entire crop to frosts.
www.perthnow.com.au/news/western-australia/wa-farmers-deliver-record-grain-harvest/news-story/0bbdbc2b0d0e3e6c422a1bc16109f4c3
It seems the northern and eastern areas had record yields. The areas the CSIRO have been predicting for decades that wheat growing is doomed because of global warming.
No question it was a hot January in NSW and Sydney, unlike the other side of the country where Perth Airport had its coldest January day on record with a monthly mean 0.3C below average.
The CSIR tables of Australian temps published in 1933 show Sydney had a January mean temp of 22.1C during 1858-1931, and Year Books show Sydney had a January mean of 22.2C during 1911-40.
Sydney’s 1858-2016 January mean is 22.3C but the 2000-2016 January mean is 23.5C. Up 1.2C since the 1911-40 average.
Meanwhile, about a hundred k north at Newcastle Nobby’s Hill where UHI isn’t such a problem, the 1864-1931 January mean was 22.6C and the 1911-40 January mean was 22.9C, compared to the 1864-2016 January mean of 22.4C and 2000-2016 January mean of 22.8C. Down 0.1C since the 1911-40 average.
Newcastle’s January 2017 mean of 24.5C was 2.1C above the 1864-2016 January mean of 22.4C, and 1.7C above the 2000-2016 January mean of 22.8C.
Sydney’s January 2017 mean of 25.6C was 3.3C above the 1864-2016 January mean of 22.3C, and 2.1C above the 2000-2016 January mean of 23.5C.
Looking west, Bathurst is listed by the CSIR with a January mean of 21.6C in 1864-1931 and the Year Books list a mean of 21.0C in 1911-40.
Bathurst (Ag Station 63005) has a 1909-2016 January mean average of 20.7C and a 2000-2016 January mean average of 21.5C. If for some reason you prefer Bathurst Airport AWS 63291, it had a 1992-2016 mean of 21.1C and a 2000-2016 mean of 21.4C.
Sydney’s Observatory Hill has been warming considerably faster than Newcastle and other stations because of UHI, which the BoM acknowledges by not allowing the station to be within the national ACORN averaged trends.
That UHI acknowledgement means it’s deceptive to claim any record (or any accurate temperature reading) at Sydney’s Observatory Hill.
A Greening Australia document parked on a NSW government domain (www.parliament.nsw.gov.au/committees/DBAssets/InquirySubmission/Summary/39702/08%20-%20Greening%20Australia.pdf), titled The Urban Heat Island Effect and Western Sydney, also suggests that in the 40 years to 2007 the western suburbs warmed at about twice the rate of Observatory Hill, with max up around 0.65C per decade.
Gidday Chris.
I give BoM zero plaudits for not incl Sydney Obs Hill in ACORN.
They have known for years that the Urban Heat Island UHI infects tiny country towns. See –
Urban heat island features of southeast Australian towns – Australian meteorological magazine 50(1):1-13 · March 2001
www.researchgate.net/publication/279699973_Urban_heat_island_features_of_southeast_Australian_towns
In case there is a paywall – I have it in pdf here
You raised ACORN – many of the BoM adjustments from outward movement of instruments in urban areas would cement UHI into the ACORN trends.
See these GISS diagrams.
How many times does a truth have to be told ? – UHI warming has been cemented into global temperature series by adjusting for steps outward from cities
www.warwickhughes.com/blog/?p=2678
I think if we had the network to measure a UHI could be shown at Nobbies. Newcastle. No worries.
Looking at the extensive BoM page and bearing in mind the expertise in the BoM
www.bom.gov.au/climate/current/month/nsw/sydney.shtml
discussing temperature data from the largest Australian UHI. Failing to explain the UHI for non-expert journalists and other readers renders the BoM page Sydney in January 2017;
“fake science news” in my humble opinion.
An example of how cloud and rain make a dramatic difference to temperatures in interior Australia. Kalgoorlie Feb average high temp is 32C, and under cloud and some rain yesterday and today, highs were 18C and 17.4C.
In the West over the last 3 or 4 years we seem to be moving to wetter summers with more tropical summer rain (and colder winters). Ocean cycles, IOD? Nobody seems interested in finding out.
Canberra has had a couple of days v cloudy with no great heat –
www.australianweathernews.com/data/DE1_70.HTM
and Feb started with a coupla days showers.
Worth checking the weekly Max anomaly maps for Australia – just click back through 2017 – plenty of cool areas to mostly counterbalance the warmer areas. So the period of more moderate temperatures the continent has experienced since June last year is carrying on.
www.bom.gov.au/jsp/awap/temp/index.jsp?colour=colour&time=history%2Fnat%2F2017011820170124&step=0&map=maxanom&period=week&area=nat
The map due at end Jan is missing but will appear soon – some quirk of BoM codes.
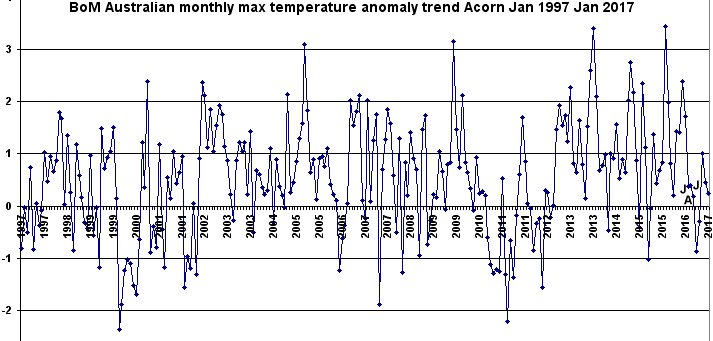
To illustrate what I meant by “…period of more moderate temperatures the continent has experienced since June last year…” Here is a chart of Acorn monthly max anomalies down loaded from the “Time series graphs” BoM page –
www.bom.gov.au/cgi-bin/climate/change/timeseries.cgi
I have annotated June July August JJA on the chart – it is easy to count on from there. Larger version chart
Ian George,
We need more pof the objective indicators like birds dropping from the sky around Bourke 1896. Wish I could find some more. Things in other countries like shifts in mountain tree lines. Glaciers, hard to interpret, none here. Way out things, given big Australian deserts – are there lake sediment signals say at Lake Eyre showing relative populations of avian species – like how often are there those huge bursts of pelican numbers?
Sometimes I think they have put research spending on the wrong topics.
Geoff
Very cold across SW WA today. Perth looks to set a record low Feb Max temp with highest temp at midnight of 17.6C. Apparently previous record is 19C set in 1914. Other places should set records.