This animation for the 12th to 15th July 2016 shows a cool anomaly which moves from northern WA into the NT then into Qld.

You can see daily temps by clicking on districts at this AWN map. BoM “Climate statistics for Australian locations” give you the existing record. Change stations by changing station # in URL. To see the seven records I noted
Site name: BRUNETTE DOWNS Site number: 015085 data from 1957 – record cold day 14 Jul 2016 of 14.1 – prev 14.4 – 2 Jul 1999
Site name: TENNANT CREEK AIRPORT Site number: 015135 data from 1969 record cold day 13 Jul 2016 of 10.4 – prev 10.7 – 7 Jul 2010
Site name: MOUNT ISA AERO Site number: 029127 data from 1966 record cold day 14 Jul 2016 of 10.1 – prev 10.6 – 24 Jul 1964
Site name: JULIA CREEK AIRPORT Site number: 029058 data from 2001 record cold days 14 and 15 Jul 2016 of 12.9 & 12.0 – prev 15.2 – 23 Jul 2006
Site name: CLONCURRY AIRPORT Site number: 029141 data from 1978 record cold day 14 Jul 2016 of 11.4 – prev 13.7 – 7 Jul 2010
Site name: TREPELL AIRPORT Site number: 037036 data from 2001 record cold day 14 Jul 2016 of 8.9 – prev 11.9 – 7 Jul 2010
Site name: LONGREACH AERO Site number: 036031 data from 1949 record cold day 15 Jul 2016 of 9.1 – prev 11.2 – 7 Jul 2010
Site name: WINTON AIRPORT Site number: 037039 data from 2002 record cold days 14, 15, 16 Jul 2016 of 10.1, 10, & 12.1 – all beat prev 12.8 – 6 Jul 2010
Mt House Station in the West Kimberley told me it rained for the first time in 25 years a few days ago.
Well spotted, Warwick.
Of course people say, it’s only weather and individual cold records don’t prove anything.
But the point is, the warmers claim the whole climate has shifted. So there should be piles of new heat records and next to no cold records. See the diagram that warmers themselves use to illustrate this here: www.geochembio.com/ecology/IMG/climate-shift.png. New cold records after 50+ years make the claim that Australia’s climate has warmed by 1 degree or so over the period hard to swallow.
Facts matter to greenies, David, didn’t you know. Warm records are global warming, cold records are just weather.
Caused by a cloud mass I assume. Not common at this time of year in the North. The IOD at work.
We regularly see something similar in the WA summer when a cloud mass goes through the interior with dramatic drops in Max temperatures.
Australia’s fifth-warmest July mean minimum on record, all of the eastern States and Western Australia in the top ten Days warmer than average around the northern and eastern coast and Tasmania; cooler than average for much of Western Australia, and central Queensland
Thanks for commenting on the full July numbers Bob.
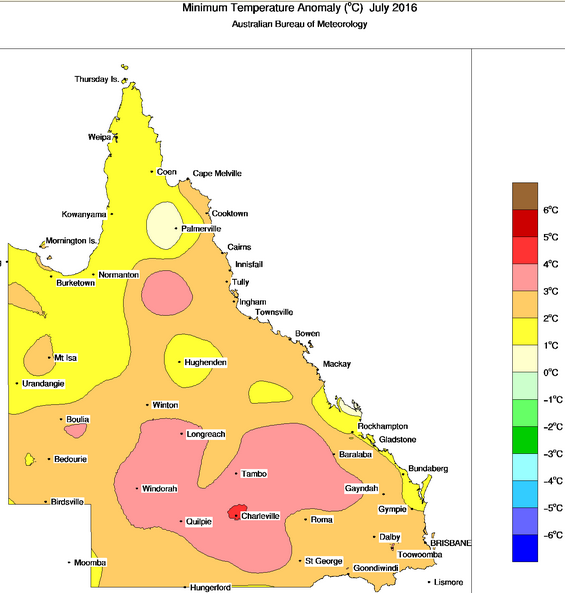
Interesting that the July max anomaly map is pretty neutral – BoM Time Series says July max anomaly was ~0.4. But turning to the minimum anomaly map and we see a very different picture with a national anomaly ~1.6.
The significance of the red bullseye in SW NT may be minimal – that is my National Nighttime Hotspot that I think I have debunked over years as a v dodgy area in BoM gridded data. OK so lets look at Charleville data – the red bullseye in southern Queensland.
Charleville Aero mean min for July 2016 was 7.8.
Charleville Aero historic July mean min is 4.3 – 7.8-4.3 = anomaly of 3.5
Charleville PO historic July mean min is 4.1 – 7.8-4.1 = anomaly of 3.7
neither of which warrants the red contour around Charleville on the July 2016 min anomaly map –
Agree GB – using the 1961-1990 means – the Charleville CDO data agrees OK with the Charleville locality on the above contour map.
Wazsah, If you check BoM’s summary for SA’s max mean temp for July, it records a +0.2C anomaly.
However when you check the actual anomalies for each site, 49 of the 70 odd sites are below average and less than 20 are above. Only two districts appear to be above average. I have emailed the BoM in SA how this could be and, though I received an acknowledgement, there has been no reply. This is a common occurrence with the BoM’s shaded maps (as we have discussed before).
OK Ian – a quick look at the Sth Aust map confirms that you are right to have questions.
Sth Aust max anomaly map for July 2016
www.bom.gov.au/web03/ncc/www/awap/temperature/maxanom/month/colour/latest.sa.hres.gif
Adelaide (KentTown) July 2016 mon mean max 15.3
www.bom.gov.au/climate/dwo/201607/html/IDCJDW5002.201607.shtml
Kent Town 23090 July mean max 15.3
www.bom.gov.au/jsp/ncc/cdio/weatherData/av?p_nccObsCode=36&p_display_type=dataFile&p_startYear=&p_c=&p_stn_num=023090
West Tce 23000 July mean max 14.9
www.bom.gov.au/jsp/ncc/cdio/weatherData/av?p_nccObsCode=36&p_display_type=dataFile&p_startYear=&p_c=&p_stn_num=023000
puzzling why Adeliade should be so far in the warm anomaly zone
Tarcoola Aero July 2016 mon mean max 18.3
www.bom.gov.au/climate/dwo/201607/html/IDCJDW5068.201607.shtml
Tarcoola Aero 16098 July mean max 18.8
www.bom.gov.au/jsp/ncc/cdio/weatherData/av?p_nccObsCode=36&p_display_type=dataFile&p_startYear=&p_c=&p_stn_num=016098
Tarcoola 16044 July mean max 18.2
www.bom.gov.au/jsp/ncc/cdio/weatherData/av?p_nccObsCode=36&p_display_type=dataFile&p_startYear=&p_c=&p_stn_num=016044
puzzling that Tarcoola would not be in the green cool anomaly zone.
I never trust anything the BoM produces without checking.
Oh for the day when questions can be asked in parliament and committees.
Maybe Malcolm Roberts? (Still no answer from the BoM but I hear they are on selective ‘strikes’ over a pay dispute).