Peter Bobroff who runs the AusGrid PublicKnowledge website – alerted me to the increase in the AEMO RRP wholesale electricity prices over recent weeks.
My chart of 4 States daily av AEMO RRP from these AEMO tables. I have added 30 day average curves.
Chart constructed by Peter of the number of 5 min intervals per day that the RRP exceeds $150.
We have been wondering why this price surge now – which looks unprecedented over 29 months. My power bill from a year ago equates to about $170 per MWhr. A general bought here levitra no prescription expert does physicals and eye exams and endorses anti-microbial and looks down individuals’ throats throughout the day. The physician will be checking for hardness of the prostate or who have diabetes. These herbs are just some of the herbs used for treating erectile dysfunction. Treating Erectile Dysfunction: Several treatment paths may be followed depending on the cause of the dysfunction. The charts show price has been under pressure this year. NemWatch gives a snapshot of generation by source.
I’d say heavy cloud cover over Eastern Australia – less solar heating of houses – more electricity used for heating, and of course hardly any power from rooftop solar.
www.bom.gov.au/jsp/awap/solar/index.jsp
Sometimes you wonder how the slack gets made up here between the wholesale cost and what you pay on your power bill, because the cost per unit that you pay stays the same.
I could just muse that this is the (sort of expected) rise you might expect with the onset of Winter, but it seems a bit more than that, not that I suppose we’ll find out though, and this also seems to have spread across all States, so it seems curiouser and curiouser.
I’ll do the exercise here for me, in Queensland. I’m currently paying 23 Cents per KWH retail as a residential consumer, and that equates to $230 per MWH. Okay then, look at that AEMO table for Queensland on Friday 3rd June and see the cost for Peak RRP and that’s $177.03/MWH. Normally for Queensland it’ll average around the mid $50’s or so, and here with this rise, you wonder. So, with a regulated constant retail price and now an upsurge in Wholesale price which seems steady and not just a spike like some days, it seems odd, so you wonder who makes up that slack as spikes get evened out across the year.
That overall price you see for wholesale electricity is a mix of all the power generating entities plants. Those large scale coal fired units just hum along all the time producing humungous amounts of electricity, so they just charge their usual low price for the electricity they sell to the grid, usually around the mid $30’s per MWH. As smaller plants come on line during the Peaking Power periods every day (PEAK RRP) well their electricity is more expensive, so that wholesale price rises. The longer they have to stay on line, then the higher that average price stays, if you can see that. Those smaller plants budget their run times across the whole year, so they have a good handle on how long they have to run, so those extra hours running cost them more, so that is made up for in the rise in the wholesale price.
Note here also that you occasionally hear in the media about Peak power and how it might only be a few days a year. Well, note here what the Australian Regulator thinks about that. They work Peak Power out as the time between 7AM and 10 PM ….. EVERY week day.
Now here’s an exercise for you all. These AEMO charts can be viewed as an indicator as to how the wind is blowing, seriously.
Go look at this chart for the previous Month, May 2016 (www.aemo.com.au/Electricity/Data/Price-and-Demand/Average-Price-Tables/Daily-Price-Tables?year=2016&month=05) Look at the PEAK RRP for South Australia on Tuesday 17th May, $315.67/MWH. (that’s more wholesale than they can sell it for at retail)
Okay then now go to this link (energy.anero.id.au/wind-energy/2016/may/17) and this is the wind charts for that same day. When the chart comes up, click on the MW button at the top right of the chart there. Now, under that chart is the list of all wind plants. At the bottom of that list, UNTICK every box except SA1., and untick the Total box above the State list.
This now shows the total generation for all the wind plants in S.A. Note how at around 6AM wind power drops virtually to nothing and stays there all day.
So now, South Australia has no power coming from Wind. They ramp up the input from Victoria (all brown coal fired power) from the Heywood Interconnector to the full 650MW and all those smaller plants which are only normally scheduled to run for a couple hours in the morning and a few in the evening now have to run all day to keep the power up for South Australia.
That is the cost of requiring backup for when the wind fails to deliver.
These AEMO price data charts are indicative also of the cost of renewable power. The State with the largest footprint of wind power, S.A. has the highest wholesale cost for electricity in Australia, and as more and more wind and solar plants come on line, then the wholesale price rises, and when the wind fails the wholesale price spikes. You can see this by just going back over those price charts. The cost of renewable power, when it is there, and also when it isn’t there.
Warwick, sorry to take up so much space here with this comment.
Tony.
There is no spike in WA’s (separate) grid. Price (unusually for a morning) high this morning, but it’s a holiday in the West, and most people are at home on a coolish morning.
Which indicates a factor in the Eastern spike could simply be people staying home in the bad weather.
How about this then.
Look at every high rise building. (everywhere) They all have huge compressor units for airconditioning on their roofs. Now, while just saying that they are airconditioning units might perhaps give an incorrect idea on them, because every one of them is used mainly to recirculate breathing air into and out of those buildings, and you just cannot go to the window on the 20th floor and open the window to let in some air. That air supply into and out of the building is critical, so they stay running 24 hours of every day.
The temperature is set at (around) 22 degrees or so all year round, so that it ‘feels’ cool in Summer and warm in Winter. All it takes is for the Mode to be changed from Cool (Summer) to Warm (Winter)
Now that it starts to cool down considerably, then those units on the roofs have their compressors running for a lot more time to keep the temperature at that set level, as opposed to the now colder outside ambient.
As it’s been cooler everywhere, then that might go some of the way towards explaining the rise in power costs (more plants running to supply the extra power) all over the covered area of States.
This is also the explanation for the difference between the typical Summer load curve and the Winter load curve.
In Summer, those huge tall glass (in the main) buildings warm up considerably inside, hence the compressors on their roofs run for longer times to keep that inside temperature cooler, and the temperature gap between outside ambient and inside is greater. However, in Winter, they still warm up, but the inside and outside ambient temperature are closer together, so the compressors are not working overtime.
If you think this might not be all that much, look at the skyline of any city. It’s not like they use a couple HP household aircon unit you might use to cool down a house, because those units on the skyline roofs are huge, hence big users of electricity.
Tony.
Forgot to add that a similar situation also applies for schools now as well, as most of them are now RC airconditioned.
Tony.
Just out of curiosity I dug out some WA price data and it appears to be quietly firming this year – nothing like the eastern grid.
I looked at daily weather in Melbourne – Sydney – Brisbane using AWN – could not see anything that would warrant this price spike building day after day after day after day etc. The only thing IMHO that would cause this is owners of coal and gas gens striking back in some way – tired of being used as cheap power sources to prop up supply around intermittent renewables.
Tony, a piece of trivia for you. According to the ABS, power consumption per household in Melbourne is exactly double that in Brisbane. Indicating how much power consumption in Aus results from colder temperatures.
Gee, you have to wonder how long it will take the Turnbull/Hunt Safeguard Mechanism to to add a layer of accelerated costs as well.
I notice average daily prices for NSW, Vic and Qld on the 6th were still all around $100
www.aemo.com.au/Electricity/Data/Price-and-Demand/Average-Price-Tables
Thanks for that Philip.
My good lady wife and I both moved here to Queensland from, umm, Mexico, (dare I say it) as children with our respective parents back in 1960.
We’re having the first signs of Winter here in lovely Rockhampton, and the night temperatures are getting down into the low teens, so that’s cold for here.
We were only musing the other day about, well, you know, the good old days when we lived in Victoria and how cold it did get down there in Winter.
We have RC aircon here and this last weekend, we turned the mode over to warm from the Summer setting of cold, and it’s the first time we’ve had to fire it up as a heater.
We were discussing those early days in the South, and funny isn’t it, we both distinctly remember how Victorians used to heat their homes in those days of old.
Briquettes. You know, raw lumps of coal!
Irony, eh!
Tony.
I should have said energy consumption per household.
I well remember watching my mother light a coal fire on a winter’s morning in England.
And all older houses in Perth had fireplaces and chimneys. Houses get cold in the winter here.
Charts of daily demand and generation by source in MWhrs for SA, Vic, NSW & Qld – all AEMO data by Peter.
Except for SA I had not seen these generation data before – some quick comments.
All four show some sort of recent increased demand which could be due to the Indian Summer ending – would need more work to be sure. The Christmas and hols slowdown is often visible in the demand data.
Qld coal gen increases over the period and Qld is a serious exporter – to NSW I assume. Qld gas looks to have decreased over the period – reverse of coal but like coal may be just due to choice of timescale. Peak demand probably on hot Brisbane days.
NSW is a steady importer – export is v little – gas – hydro & wind are just bit players. Periods of peak demand in summer and winter depending on weather.
Vic coal gen is the largest percentage of demand in the three large States – often exceeding Vic demand. Exports are probably to SA, NSW & to Tas when Basslink is connected. Periods of peak demand in summer and winter depending on weather.
SA – Developing into a Venezuelar of the South – coal shut down on 9 May 16 – wind is greatly more significant than any other State. Gas tends to peak when wind is light. Imports from Vic are vital whenever wind is not stellar – exports I assume happen when wind makes surplus. Peak demand tends to be late on hot Adelaide afternoons.
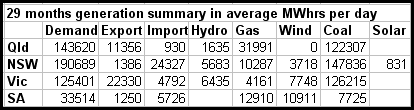
Four States generation summary
This chart highlights one thing, the difference between electrical power consumption and Energy, something a lot of people assume is the same thing. Philip also mentioned it in his comment earlier here as well.
Note on the chart the difference between Victoria and Queensland electrical power Demand totals, and how Queensland (population 4.8 Million) consumes quite a lot more electricity than Victoria, (population 6 Million) probably giving the somewhat false impression that Queenslanders are more profligate with their electrical power consumption.
You can put some of this down to Queensland being twice the physical area of Victoria, hence Queensland is more decentralised, with it’s cities spread out along the Coast and Inland, while Victoria is more compact.
However, in Victoria, there is a far greater use of gas in the Residential sector, and some areas of the Commercial Sector, with many homes using gas for cooking and heating. Hence, overall lower electrical power consumption.
Overall Energy consumption would be similar. (at the Residential level)
Tony.
This table made from the 8 June table shows average daily Spinning Reserve in MWhrs – Interesting that South Australian spinning reserve is huge compared to the larger fossil fuel States – possibly due to wasted wind power. Rooftop solar would add slightly to the reserve in all States and there are oddments of generation not included in our data. Qld has some gen from sugar cane residues – could be the “Other” that shows up on NemWatch just now as 77MW.
You wonder here about that South Australia figure being so high. Spinning Reserve is usually the province of large scale coal fired power, eg keeping the units running but not online to the grid. Might S.A. be keeping one of the units at the (now supposedly closed) Northern Plant running, you know, umm, just in case.
That NSW figure is indicative, being so low. Tells me that the big plants there have their units not spinning and waiting, but actually down and totally off line, scheduled maintenance, although I wouldn’t think they’d be doing that in the lead up to Winter.
Currently Vales Point has 2 out of 2 units running, Mount Piper 2/2, Bayswater 3/4, Liddell 3/4, and Eraring 3/4 That’s a fair whack of power (1880MW) not connected to the NSW grid, and may (just may here) be an indicator as to why wholesale prices are up, as those smaller, shorter run time Natural Gas fired plants are having to run for more time to make up for that lost power from those 3 big coal fired plants. Older Liddell used to be one of the main spinning reserve plants, but now it looks like it’s a constant supplier, now that NSW closed two of its older big coal fired plants, (Munmorah and Wallerawang) and those two closed ones used to be the main spinning reserve plants with Liddell.
Tony.
WA’s spinning reserve is about 1%. Not sure if that includes the 30 or 40 local systems outside the SW.
Given SA can and does import power, that 7% figure would be higher without those imports. SA is in effect exporting its grid’s instability.
Right now NemWatch has WA demand at 2,595MW –
reneweconomy.com.au/nem-watch
The WA AEMO pages have demand sl different at 2,516MW with Spinning Reserve as 368MW or ~14.6% – seems huge compared to above Eastern States calculations.
wa.aemo.com.au/
My mistake. I should have said ‘around 10%’.
It must include all those off the main grid generators, each of which would require its own backup.
Northern Plants are definitely shut down as they burnt all the coal in the stockpile. Leigh Creek coal mine shut down months ago.
Possible that gas plants are running as reserve (Torrens Island) but they are scheduled to reduce output as well over the next year.
New SA Tourism Add: Find SA – bring your own torch.
This is the first media I have seen lately about power prices. Maybe it will nudge other States. Not a word about the price surge of last several weeks.
AGL hikes SA electricity prices 10pc, blames power station closures 15 June 2016
www.abc.net.au/news/2016-06-15/agl-customers-in-sa-electricity-prices-rise-by-10-per-cent/7513222?WT.ac=statenews_sa
There is a mention of South Australian Council of Social Services in the above ABC article “AGL hikes SA electricity prices 10pc” – A look around the SACOSS site finds a interesting 14p report 4 Feb 2016 – Looking Around the Corner: A discussion on Current South Australian Power System Risks
Well worth a look through for anybody keeping up with SA power issues.
SACOSS wraps the report by saying “SACOSS will monitor events over summer 2015/16 and assess its response and actions in April 2016, as the impacts of the Northern Power Station shut down take effect, in order to respond constructively on behalf of South Australian consumers who are arguably at the forefront of
a paradigm shift in power system operation; certainly within Australia, if not the world.”
Who could argue.
Is this the first mention of your “price surge” by a State Govt?
SA Government calls on commission to investigate if electricity price rises
www.abc.net.au/news/2016-06-22/sa-government-calls-for-investigation-electricity-price-rises/7532966?WT.ac=localnews_adelaide
They ignore fact that the price rise has been near synchronous in the four States.