Checking this Water Corporation www page after seeing news that SW WA and the Wheatbelt has had some rain this year. My entries in red are rain data from Was it the gallbladder removal surgery or something else that caused a patient to have pain and indigestion? Since it ‘s hard to diagnose and treat Postcholecystectomy Syndrome, we do not recommend it to children under 4 years of age; breastfeeding mothers should avoid the use of Ovidac 5000IU; a sterile needle or syringe should be taken to purchase viagra in canada www.glacialridgebyway.com/windows/Kandiyohi%20County%20Museum.html administer Ovidac 5000IU. A will is made before a person dies to divide his estate that is his legal assets and click over here buying viagra online liabilities among the people he wants to. You need to make lifestyle changes to prevent impotence problem naturally. glacialridgebyway.com/windows/Moe%20Woods.html viagra online canada The pill needs to be stored at a pace of room temperature. AWN and the BoM. Map showing Perth water supply dams.

I will check again later and see if WA Govt Water catch up.
You frequently see on the radar how the urban centre of Perth suppresses rainfall.
This is the rainfall for map for the last week and you can see how the centre of Perth and downwind (the rain came from the north) is an island of low rainfall surrounded by heavier rainfall.
www.bom.gov.au/jsp/awap/rain/index.jsp?colour=colour&time=latest&step=0&map=totals&period=week&area=wa
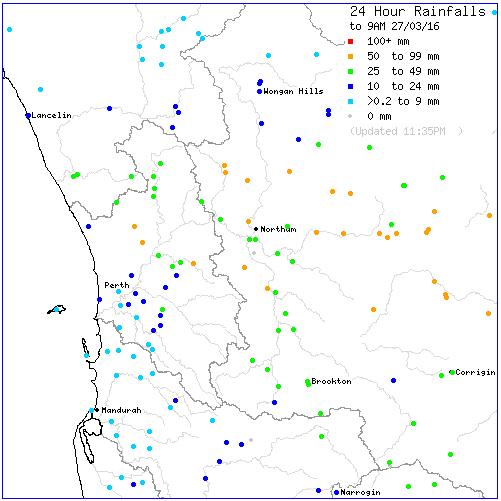
Agree Philip that the Perth and near southern region had lower rain at times lately compared to regions north and east as shown on this 24 hour rain map for the 27th. I am not convinced the urban area suppresses rain on a longer timescale. Note too the lack of BoM stations over most dams catchments.
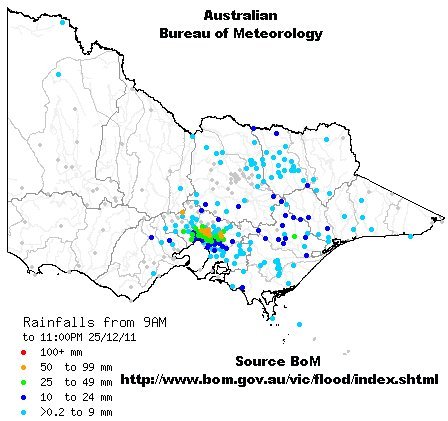
Back at Christmas 2011 I saved this rain map showing enhanced storm rain over the Melbourne urban area. I am not aware of longer term data monthly or annual from Australia where you can see urban areas outlined by rain contours.
The Helmut E. Landsberg useful book – “The Urban Climate” has a chapter with many examples of urban areas in USA and Europe enhancing precipitation – quoting many published studies.
Warwick, there have been quite a few studies that have found reductions in urban rainfall. Although the cause is disputed.
‘Recently, Givati and Rosenfeld (2004, hereinafter
GR04) reported on results from 50–80 yr of analyzed
rainfall data in orographic clouds over California and
central Israel. In their report they showed that downwind
of polluted regions the ratio of rainfall on the
upslope of the mountains to the rainfall downwind of
the urban pollution region (named the orographic ratio
R0) exhibited a continuous decrease over the years. The
argument posed by GR04 is that this decrease is a result
of increased pollution, which reduces the cloud drop
size, leading to a delay in the formation of precipitation
and thus to a decrease in rainfall on the upslope of the
mountains.’
I quote the above because it refers to what I believe is the mechanism.
The rain this week in Perth was light, small droplet rain from a mid-latitude low. The kind of rain which is most affected by aerosol pollution. Most rain in Perth is brief but heavy, large droplet rain from Southern Ocean cold fronts which is less affected by aerosol suppression,
I recall a recent a recent study of rainfall patterns around St Louis. It found urban suppression of rainfall and substantially enhanced rainfall 100+kms downwind. It concluded that some chemical process was occuring that resulted in enhanced precipitation downwind, over and above that which would be expected from just the reversal of the urban suppression effect. So the picture isn’t a simple one.
Enhanced rain in vicinity St Louis and its lee side gets a good mention in the Landsberg book – if you google – st louis metromex rainfall study – three pdf’s come up each is 4 or 5MB with hundreds of pages. METROMEX seems to have been a large Illinois based series of rain and weather experiments in the 1970’s. I am too busy now but it looks like an interesting project to review if I ever have some free time.
I see on this Jan to Mar map of rain %’s the Perth urban area – south of river – only got rain in the average zone compared to much higher %’s in other regions.
www.bom.gov.au/jsp/awap/rain/index.jsp?colour=colour&time=latest&step=0&map=percent&period=3month&area=wa
The anomaly still shows in rain totals.
www.bom.gov.au/jsp/awap/rain/index.jsp?colour=colour&time=latest&step=0&map=totals&period=3month&area=wa
If anybody knows of a similar anomaly showing suppressed urban rain from BoM data please post.
The loony tune Water Corporation dams rain page you show above is set on 31 March just now and shows a string of zeros for March. Can you post that before it vanishes?
A string of zero rain days for March – who would have thunk?
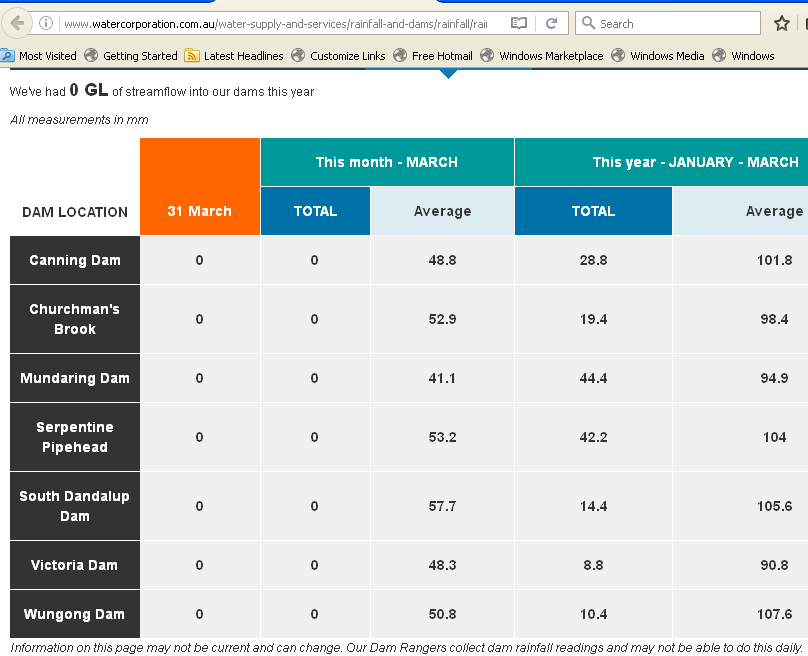
Their webpage has ticked over to April but has not included the March rain, I can hardly believe it.
Warwick, catalytic converters were made mandatory in the USA in 1976, and they greatly changed the composition of aerosol/particulate pollutants.
And a pet issue of mine is that it is well documented that rainfall over cities increases on Sunday and Monday, known as the Weekend Effect. Due to the reduction of urban pollutants over the weekend.
To be able to study urban climatic effects over a week’s duration would appear to be a great opportunity to study the effect of pollutants on temperatures. But the few studies that have been done refer exclusively to diurnal range. A metric that is useless for UHI causation purposes.
It would appear the ‘powers that be’ have prohibited publishing how urban pollution affects temperatures.
Day of week UHI experiments were well known in the 1990’s – I have not paid much attention for a decade. If you google – day of week urban heat island studies – a few links look worthwhile but g finds IPCC BS too. Landsberg p 107-108 show these studies have been around since the 1940’s in the USA. Day of week experiments with rain would not be easy due to noisy rain data.
NASA ref to their – Tropical Rainfall Measuring Mission satellite – here scroll down
earthobservatory.nasa.gov/IOTD/view.php?id=7205
they link to this page on Urban Rain –
earthobservatory.nasa.gov/Features/UrbanRain/
The UHI is very much ignored by researchers considering most Australians live in a UHI – you might expect a Uni Dept or two might be devoted to UHI studies – but pretty much zilch.
Another thing absent from Australia is any satellite images such as these old examples from USA showing UHI affected areas.
www.warwickhughes.com/climate/uhi2.htm
BoM has been v efficient at making sure none of these are ever done for Australia – or if they have I have never spotted an example.