This subject has come up in my previous post – The Conversation blog in discussing “was the 1896 heatwave wiped from the record?” – wipes BoM 1996 finding from the records –
In 1997 I published a Comment on the subject of the 61 year long Adelaide temperature experiment –
1997 Hughes, W.S. Comment on, “Historical Thermometer Exposures in Australia.” by N. Nichols et al. International Journal of Climatology, Vol. 17, pp. 197-199. Downloadable here.
The following are my Fig 1 Glaisher minus Stevenson maximums for the four seasons. The two pink S’s mark the installation of new larger Stevenson screens in 1898 and 1901. In my opinion the most reliable parts of the data are (marked with blue R’s) – the first five years to 1892 before the trends deteriorated to peaks around 1885-6-7.

In the first five years staff were more likely to be paying attention to the experiment. Then the few years 1898 to 1906 after the larger screens were installed also look to have consistent differences without drifts and jumps.
So I think a fair judgement would be that the 1°C summer max difference quoted by the BoM is probably far too high and reflects deterioration of the equipment or site of the experiment. A truer figure might be half of that. I can not find the chart data now – but it must be in BoM or Swinburne archives.
Minimum differences fall in a tight band around zero until a huge change sets in at 1938.
Text below is from my 1997 comment
Dual readings commenced in 1887 and multiple records exist until 1948, which leads Nicholls et al. (1996) to make the point that ‘This period of comparison far exceeds other comparisons between stands and screens, as reported in Parker (1994).’ Perhaps the long period of this comparison is less of an advantage given the numerous equipment and site changes. It is possible that interest in the comparison only lasted a decade or so and then it simply ‘ran on’ because nobody took a decision to cease the dual readings. Factors such as differential equipment deterioration could have set in, causing some of the trends seen in the difference time series. Nicholls et al. (1996) present no time series showing trends over the 61-year period and make no mention of equipment changes
or site variations.
Richards et al. (1993), in Appendix 5, record a four page summary of station history supplied by Dr N. Nicholls and compiled from Bureau of Meteorology records and archives, which details as best as the old records will permit, at least six screen changes over the period, with at times more than two sets of instruments recording concurrently and a site change to new offices in 1944. In this summary the old style thermometer enclosure is referred to as a ‘Greenwich stand’. Richards et al. (1993, p. 14), refer to the four page summary as ‘ … vague and ambiguous, and did not make clear when and where equipment was moved.’ Climatologists who have researched 100-year-old records would not be surprised at this. However, readers of Nicholls et al. (1996) are provided with
no hint of the inhomogeneities related to these site changes, which can be seen in both the maxima and minima difference seasonal time series shown in Figure 1.
The maxima graph shown in Figure 1 reveals discontinuities in the data at the time of four of the instrument changes, which might have been enough to impress the Richards et al. (1993) team that external non-climatic forces were impacting on their data at specific times. Field-book entries summarized in Richards et al. (1993) indicate five screens operating at various times over the 1887 ? 1944 period, sometimes with parallel operation.
Changes are indicated in January 1898, October 1901, May 1910 (missing readings), November 1925, October 1938, July 1939, June 1940, November 1940 (these 1940 installations were 45 m north), and July 1943 (possible site change), and in February 1944 a continuous series of readings since 1925 ceased, and the 1940 installations continued at a new site. Several of these dates appear to be reflected in abrupt changes in the course of some of the seasonal traces. However, Richards et al. (1993) concluded that the variations in monthly maximum
differences could ‘ … be seen as randomly scattered.’
Three changes in the dimensions and volume of the Stevenson screens are recorded. The first screen measured 38.1 x 55.9 x 45.7 cm (0.097m3), from January 1898 a larger unit measured 61 x 69 x 38.1 cm (0.16m3) and in October 1901 this increased to 61 x 78.7 x 40.6 (0.19m3).
Warwick,
there was a major change in 1909/10 when the State Astronomer left to join the newly formed BoM.
Another change was Glover Avenue was built in 1925 as the northern boundary, which had previously been parkland. This would have led to traffic going past – trams and cars. The area a few miles west along Henley Beach Rd. (connects with Glover Ave.) was market gardens until the 1930’s when an outlet to the Gulf was cut to help drain the swampy land behind the sand dunes. When this dried out the local hydrogen sulphide emitting bacteria died out and the land along Henley Beach Rd. became the Airport, and new sub-division, hence more traffic along Glover Ave.
There is a mention from 1939 about shade trees should be planted along the southern boundary to ‘hide’ the building from the proposed Adelaide Boys High School (which wasn’t built until 1951).
It seems that the Weather part of the observatory was in the NE corner bounded by Glover Ave. and West Terrace, and on the other sides by the Observatory including the 2 story Astronomer’s residence, stables etc. with these latter being demolished after 1940. The Commonwealth took the area of the Weather Bureau in 1940, hence references to the Bureau being there 1940 onwards, whereas it seems to have always been somewhere there as ref. to Colonel Light making weather observations in 1839 in Ellis park (he fancied the site as its elevation enabled him to see to Glenelg).
Incidentally the elevation of the front door step was 192 feet above sea level.
I take it that you have the photos of the thermometer house in front of the old Observatory. There is a (poor) one showing the ’round’ house plus 2 other screens, taken before the 1921 radio fixing of the SA-NT boundary, and one showing that the 2 may have been moved.
It is worth noting that Sir Charles Todd retired in 1905 or 06 at age ~80 – the point of my final blue ‘R’. I doubt anybody “owned” the experiment after that.
en.wikipedia.org/wiki/Charles_Todd_%28meteorologist%29
Wazah
Am trying to figure out when the round house went in. For the year 1896 I have all the data for this site from it, from the Stevenson, from the Glaisher and from a sling thermometer that was also there. The round house maximums for 1896 were not much different to the stevenson screen. So i say it would give the best maximum data preceeding 1887.
This experiment goes back much earlier than 1887 (perhaps a couple of decades) as a comparison between it and the Glaisher.
As you can see from this photo there were two Stevenson screens at the same time in 1930.
jonova.s3.amazonaws.com/photos/history/west-terrace-termperature-observations.jpg
The Round house may have put morning shade on or near the other one. Do you know which Stevenson data you have for 1930?
Lance Pidgeon.
Graeme No. 3
I was a bit confused about the location of the screens there. So I went there and read the signs on rocks and monuments, then concluded after digging up a few old bits on Trove that the Weather Bureau in 1940 was in that corner but that the sreens were at the end of Waymouth st where there is a School staff carpark, lane to sports parks and parkland now.
Some cluses to the location. Note the gate in both of these.
images.slsa.sa.gov.au/mpcimg/09250/B9182.htm
images.slsa.sa.gov.au/searcy/10/PRG280_1_10_287.htm
Scroll down TWICE on this one and note what you DO NOT see beside the round house!
www.setterfield.org/Dodwell/Photographs.html
Use the zoom to check out No 27 on this map.
trove.nla.gov.au/ndp/del/page/5730013?
Am beginning to wonder if I have been wrong and the old records came from the round house and that Glaisher inside it IS the bulk of the pre 1887 record. Hmmmm?
Theory must wait. Things to do.
Lance I assume the photo of the Octagonal shed on the Setterfield www site was taken after it was in front line active use and that a Stevenson screen was somewhere else.
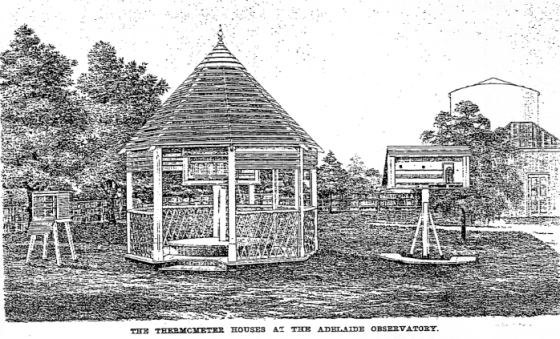
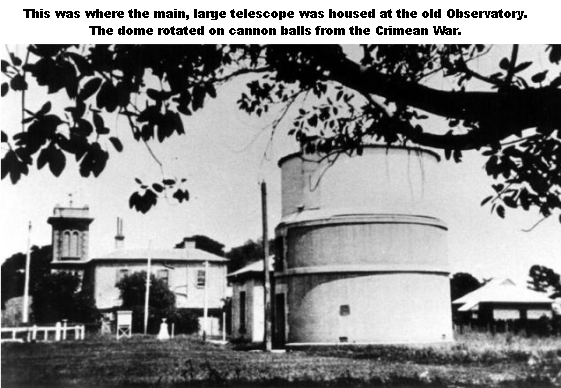
Just for interest I include this drawing given to me by the BoM in 1992 – exact source or date not known. Is that a gasometer – silo ??
Ah!! of course – it is the telescope house seen in the photo below from the Setterfield www site – note the Stevenson screen –
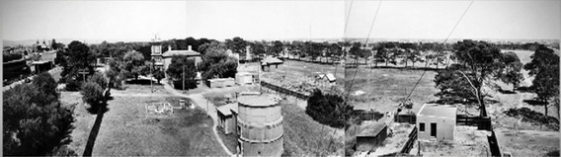
Somebody has built this aerial panorama looking south.
Could this be before WWII – possible Stevenson screen to left of driveway.
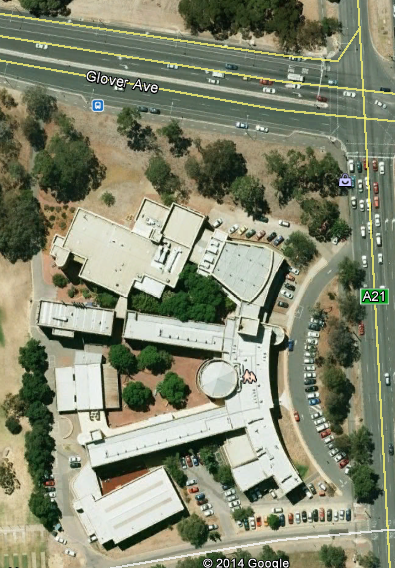
And the site now seen from GoogleEarth – with round structure.
A reader has emailed this in several hours ago – so it probably belongs a few comments higher. (too many links to pass the anti-spam gizmo)
wazsah
Sir Charles Todd (retired June 1905) but, despite the Public Officers Retirement Act (1903), he did not leave the State public service until 1907. “In his later years he ruled his departments as a benevolent autocrat” – Unlikely that anyone didn’t take care with the readings while he was still around.
Succeeded by Griffiths, Richard Fletcher, 1857- 1930? who left after 2 years to join the new Commonwealth Dept. of Meteorology
Succeeded by Dodwell, G. F. (George Frederick), 1879-1963 who was mostly interested in astronomy. Retired 1952 (aged 73 ) when old observatory demolished.
trove.nla.gov.au/version/14919885 shows all 3 of above
siliggy
Of General interest?
www.salife7.com.au/adelaide/places/historical/the-adelaide-observatory
small but clear picture 1900? showing western Stevenson only.
www.bom.gov.au/climate/data-services/about-data-observations.shtml
GENERAL LAYOUT of Adelaide Observatory,1940 State Library of South Australia
The Adelaide Observatory, and associated buildings, looking south from the North East corner of West Terrace and Glover Avenue.
Also www.setterfield.org/Dodwell/Photographs.html
has 2 undated pictures but I think one is around 1921 (from square block) when the State boundaries were measured using radio waves.
I think that the eastern Stevenson was installed Oct. 1901 as the 1898 one was surely a replacement for the original (in same position) which was unlikely to have collapsed in 3 years. But the screens may have been moved for the 1921 radio work, but then put back.
Much is clearer now thanks to this spliced 1940 aerial panorama from the State Library of South Australia on Flickr.com
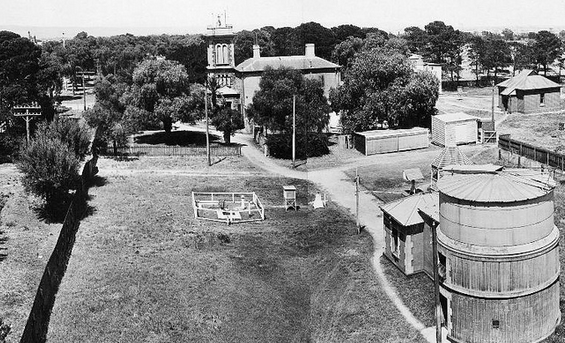
“The Adelaide Observatory, and associated buildings, looking south from the south corner of West Terrace and Glover Avenue.”
The top of the Octagonal thermometer house is clear above the telescope house – with Glaisher stand just to its left – then Stevenson screen further left over driveway.
Link is second from bottom in above comment sent in by Graeme No.3 but devoured by the anti-spam plugin. Even my own comments often get caught. Currently spam comments are running over 6,000 per day – so unless I can get to the list very quick there is no chance of rescuing a good comment. So my advice is always keep comment text offline in case it is lost and you can email it in.