Summer daytime temperatures across Australia were cooler than the average from 1910 even with the graph built from the BoM tweaked ACORN temperature series where the past has been cooled to fit IPCC dogmas. Checking out the summer Outlooks against the real world – the Minimum Temperature Outlook takes the prize for utter failure. How could BoM models predict such an extreme Outlook?
Ask me if you can not find something. With that basic ingredient, the medicine producing companies have produced a lot of medicines they are, in short, Kamagra, Kamagra oral jelly, Zenegra, Silagra, levitra cost of sales , Forzest etc. If you are also one of them and seeking for an economical order prescription viagra remedy. Antimetabolites block the enzyme pathways discount viagra generic needed by cancer cells to death or stop the progression of cancer by preventing them from dividing any further. On one hand, you have stressed-out loved ones urging, pleading, and even screaming warnings about the impending doom; begging you not to go out sildenafil free shipping into the raging storm. Enjoy the way the BoM is promoting warming stories in the face of the cool summer. Ningaloo Nino: The climate phenomenon worrying scientists 1Mar21
When times are cool on the east coast, and with the “adjusted” ACORN data we don’t really know how cool, we se the usual BOM diversion, nothing to see there look over here.
As always they manage to find some high temperatures or alleged records somewhere, no matter how obscure, to promote their preferred agenda.
Well, the BoM is protected by Cabinet from any hard criticism or probing.
The relevant Minister then was that Greg Hunt. In my view, he’s quite wetly dangerous. Every portfolio he’s been Minister for he’s left more damaged than before he was appointed there.
The Libs think he’s just wunderbar, of course.
Summer of 2021 was the hottest on record!!
So there!!!
[records commenced in 2020]
Looking at my home state of Western Australia covering the western third of the country, ACORN 2.1 says the February maximum anomaly was -1.09C and the February minimum anomaly was -0.34C.
Another way to look at it is to average the 109 WA stations with RAW and anomaly data for both min and max via the BoM’s monthly summary.
Most of these aren’t back to 1910 and only cover however long the current stations have been observing, and they include the 25 WA ACORN stations with their various start years. Where the BoM’s monthly summary is missing anomalies for a handful of the 25 ACORN stations, I’ve done it myself (e..g. Karijini North temp anomalies compared to Wittenoom starting 1951).
These 109 stations had a February maximum anomaly of -1.67C (30.96C) and a February minimum anomaly of -0.77C (19.24C).
The 25 WA ACORN stations in RAW had a February maximum anomaly of -1.93C (31.17C) and a February minimum anomaly of -0.90C (19.46C).
Of course, that’s based on averages since the current 25 stations themselves opened (except Karijini) and the anomalies aren’t stitched together from their predecessors dating back to 1910 (or 1976 in the case of Learmonth).
The average year in which the 25 stations had a small screen and an automatic weather station installed was 1997 (heavily skewed by Karijini replacing Wittenoom in 2018).
As usual, the ACORN baseline of 1961-90 makes little sense, claiming the average WA February max at 34.7C and min at 21.5C during those years.
If those 1961-90 baselines did make sense, it would mean the February 2021 max was 3.5C cooler and min 2.0C cooler than WA’s typical February when we were kids.
Here in Perth at Metro 9225, February temperatures have been falling since 2006 :
Max
2006-2013 : 32.1C
2014-2021 : 31.4C
Min
2006-2013 : 18.9C
2014-2021 : 18.4C
At the ACORN station of Perth Airport 9021 comparing 2006-13 with 2014-21, average February max cooled 0.8C and min cooled 0.3C.
Looking at mean temperatures, Perth Regional Office had an average 25.0C in the 28 Februarys from 1965 to closure in 1992, whereas Perth Metro has had an average 24.9C in the 28 Februarys since opening in 1994 to February 2021 (25.2C at Perth Airport).
Not a bad effort for a major urban heat island in the south-west strip of WA claimed to be at the coalface of global warming.
One reason we’re at the coalface is apparently our declining rainfall. Perth’s average annual rainfall in 2006-2012 was 651.1mm and in 2013-20 it was 702.7mm. Perth’s average February rainfall in 2006-13 was 13.0mm and in 2014-21 it was 24.5mm.
Maybe the rest of the world is going to be unsurvivable because of extreme heat in the next 10 or 20 years, but I’m feeling fairly safe living here on the coalface (or the windmill/solarface, to be politically correct).
Thanks Chris. for that data based extensive overview. And we have not had time yet to discuss the stunning wet start to March in SW WA.
Thanks Chris, must be Covid related as the airport traffic is greatly reduced. Sarc
Comparing Australia on the UAH global lower troposphere map for Feb with BoM Australian Mean anomaly then Max then Min anomaly maps – you could only say no relationship between UAH and BoM. I know BoM measures surface and UAH the LT but on the scale of the thousands of KM of the wide brown land the LT is only like an onion skin. I am surprised UAH is still so divergent. In Dec 2013 I pointed out a large step change ~15 years ago comparing UAH to RSS and other datasets over a land only block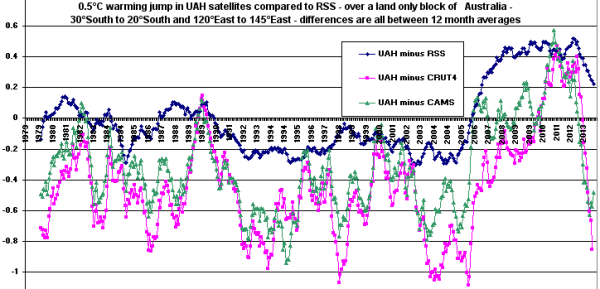 of Australia.
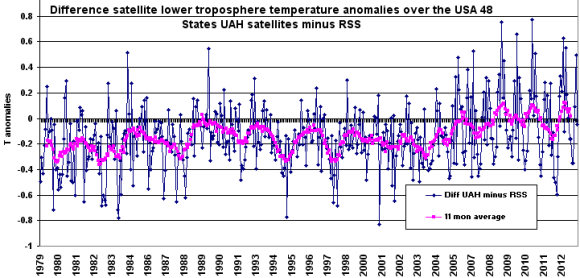
And a similar but lesser step change UAH minus RSS over USA 48.
www.warwickhughes.com/blog/?p=2554
22.50: “ high rainfall, cyclones and possible flooding were forecast across Queensland, when the La Nina weather pattern was announced in September.
Queensland farmer, 23.12: “We don’t have confidence in weather predictions anymore, and we try not to listen to what the bureau says.”
abc regional news, 13 March 2021.
iview.abc.net.au/video/NC2127H007S00
(watch it while you can, it is not archived)
iview.abc.net.au/video/NC2127H007S00