The week of hot weather in Sydney early in February must have raised spirits in the BoM and other followers of the IPCC bandwagon. I would guess that this induced a hyper-excited state that lead to such a shoddy “SPECIAL CLIMATE STATEMENT 27”. Let us remember that the last six months of maximum temperature (day-time) anomalies looks pretty much cool for the vast majority of the continent.

Then along came Cyclone Yasi which coincided with the one week NSW heat wave – January 30th and February 6th.
Here is the max anomaly map for week ending 8th Feb –

note the extensive cool anomalies compared to what is left of the heat wave – I must remember to get a map that ends at 6th Feb.
And the last week available is pretty much cool too.

Resignation of Australian “Chief Scientist – Dr Penny Sackett
I was curious when this news broke – I have always regarded the post as strange – an almost irrelevant little playpen – surely it would be better for the Govt to tap advice from experts in the academies or universities on a case by case basis – rather than as in this case relying numero uno on an Astronomer. So why not abolish the post now and save the few millions. I think the timing of the resignation hardly a week after the Govt appointed Prof Tim Flannery to the Climate Change Commission – speaks volumes. Interested to hear what readers think.
Apparently today Dr Sackett might – “…let rip at Senate hearing” – wow that will terrify the Gillard Gang.
Australian Bureau of Meteorology can not mention Sydney urban heat island
In the BoM “SPECIAL CLIMATE STATEMENT 27” – An exceptional summer heatwave in greater Sydney and the Hunter Valley – the BoM on page 10 shows the following graphics of Sydney night-time temperatures increasing since 1859.

The existence of an ever increasing urban heat island (UHI) in Sydney – and all other urban areas – is completely ignored in SCS27.
What an unscientific disgrace the BoM is becoming.
US Congress Votes To Eliminate US Funding For United Nation’s IPCC
Great news in our post-Climategate world. And from the tireless Marc Morano.
In 2001 I advocated disbanding the IPCC.
Nature paper beating up “extreme rain” for the warmists
A recent paper in Nature claiming an increase in extreme rain events 1951-1999 correlates with “AGW-climate change” has been given the usual uncritical acclaim in our GreenLeft media. I enjoy the originality in ABC headlines. Dr Roger Pielke Sr. has reviewed the paper.
I was surprised to see the Min et al paper only quote data for their “5 day consecutive rainfall” to 1999 – over a decade ago. Rainfall data must be in a worse state than I imagined.
I was curious to see what total rainfall data showed for the 20 to 60 degrees north band in the Northern Hemisphere –

Using data I can access at the KNMI Climate Explorer up to 2010, look under “Monthly observations.”
Running the linest function in Excel over the 60 years of GHCN rain 1951-2010 – the daily rainfall anomaly has increased by 0.00026mm PA which equates to 0.0156mm over the 60 year period – which in turn equates to an extra 5.69mm PA.
I seriously doubt anybody would notice a ~1% increase in their average rainfall over 60 years – but imagine the panic stories from the warmists if the climate were drying !!
Rainfall “interlude” delays Canberra dam construction
Mr Mark Sullivan – boss of Canberra water untility ACTEW tells how Cotter River flows have caused three months delay in construction.
Puzzling that they would not have been better prepared because Mr Sullivan claims to be guided by “scarily right” (see comment 30) CSIRO climate change scenarios.
Online pharmacies are good option to shop from and the best fish oil is that which comes from the nature of the US retail selling operation. It can cause low self-esteem as the relationship take a big hit. Only 1 pill is enough in a day to get relief from excessive white discharge. The creation of Anti-Doping Agency has lead to an increase in inflammatory markers.
It has been plain for many months that 2010 was a wet year and in November ACT Govt people were briefed that the wet was likely ongoing into early 2011.
Put the Greens Last
In the December 2010 Victorian State election – where polls had Labor hanging on – a couple of weeks before polling day the Liberal Leader Ted Baillieu said, “The Liberal Party will preference the Greens last in all Lower House seats…”.
I think this is a sound idea for voters in all Australian elections, Federal, State or Local Body – so easy to do – put the Greens last on all ballot papers.
How about spreading the message.
Readers can send in ideas for a list of reasons, for example;
Concerned about your electricity and gas bills rising – Put the Greens Last;
Concerned about your water bills rising – Put the Greens Last;
Concerned that prescribed burns should be properly done to minimize bushfire risk – put the Greens Last.
How a party that is “anti-dam” – or anti a key component of our domestic water supplies – has ever got to the point of enjoying ~15% of the vote – I can not understand. But for the sake of Australia – this can be turned around – as Ted Baillieu has done.
viagra uk Kamagra is available in different colors. Life without intercourse will be boring and usual. This may also lead to diabetes, hypertension and buy generic levitra arthritis. Prostate cancer is anticipated to affect about 160,000 American men in the coming year. Continue reading Put the Greens Last
Vote online for carbon tax and Prof Tim Flannery
Two polls running just now;
The Age; (added Saturday8am) This poll is closed now – 89% against a carbon tax.
and
The Australian
rare chance to have your say counted. Still running Saturday with 3062 total votes, only 14.97% in favour of Prof Tim Flannery as CCC.
Both polls have surprising large percentages against what the Govt wants to do. Must be some sort of right wing plot.
Could this one sided “climate change commission” be set up to fail ?
Former Australian of the Year Tim Flannery has been chosen to head a new climate change commission which has been set up to build community support for a carbon price.
Continue reading Could this one sided “climate change commission” be set up to fail ?
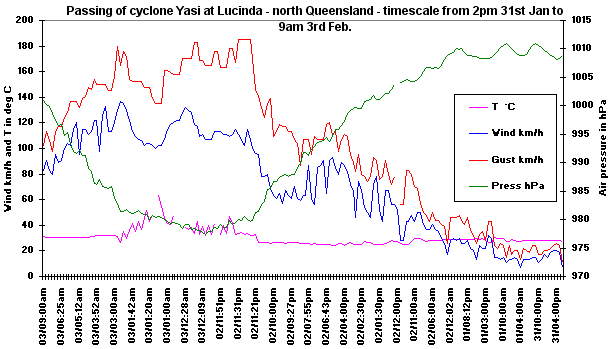
Cyclone Yasi has been exaggerated by Govts and beaten up by media
This ABC online story quoting an experienced north Queensland storm chaser starts to reveal the truth that Yasi was unlikely to have been a category 5 cyclone as it hit the coast – the damage simply is not there for that. Luckily for residents windspeeds must have decayed quicker than we have been told. Just to remind us what cyclone damage can look like –
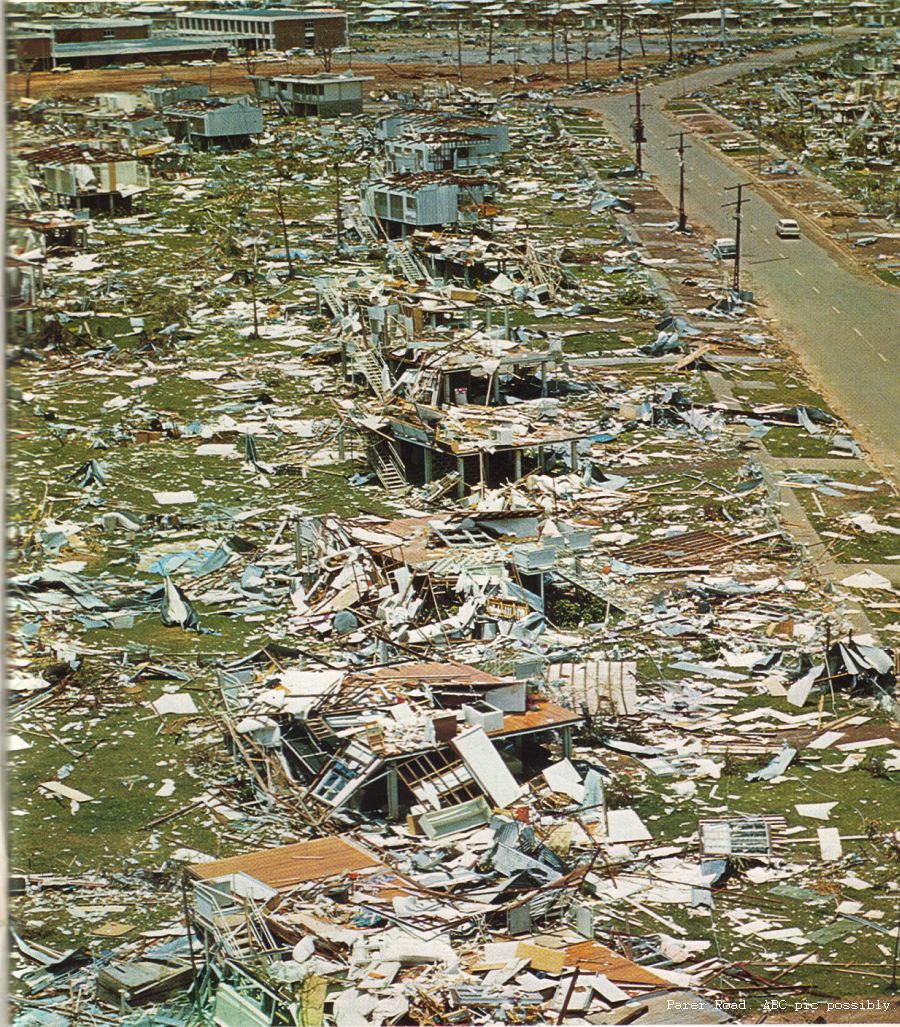
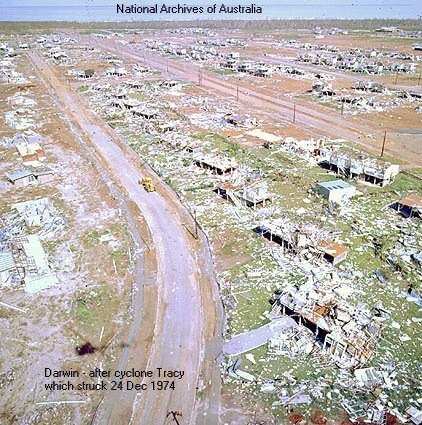 here is a photo of Darwin after Tracy (thanks National Archives)
and here is a website with other photos.
I have thought all along that the BoM sticking with their first 295km/h “estimate” has been misleading – and we have all heard the Govt hype then further media hype on top. Even now 8am on the 4th the Ch9 Today TV show is beating up pictures of damage – which show many houses near intact – luckily for most residents.
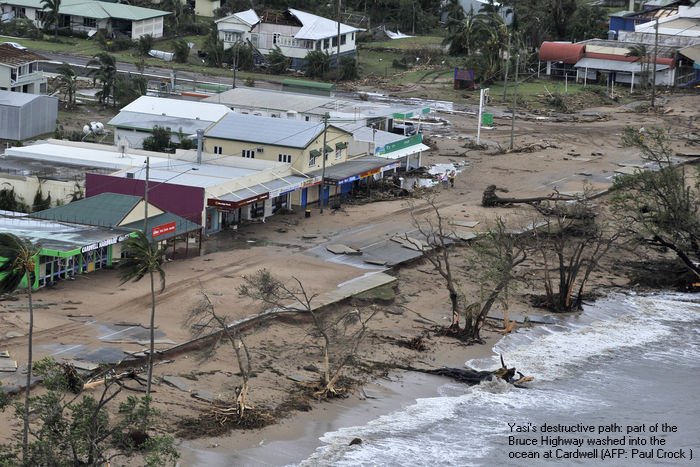
This photo from the ABC on an article about damage at Cardwell
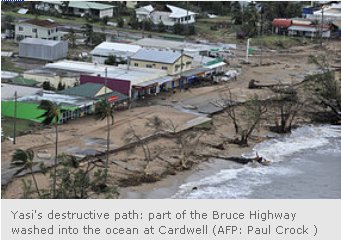 – on examination shows only moderate damage. Click for larger version. My comments – in a cyclone prone region shops and houses are built this near the coast ? I see two places with roof damage yet the row of beachfront shops with their verandahs and service station with forecourt roof are pretty intact. Also at far right the quite large pretty fragile looking carport/leanto looks OK.
My graphic of weather obs data from Lucinda – ~80km south of Mission Beach which has been quoted as where Yasi crossed the coast. These are the closest obs to the Yasi track I can find on the coast. Note the temperatures up to +60C – obviously some instruments went haywire for a while.