Thats in Vic based on Warrnambool ABC reports – Councillor calls for $1m drought support funding to be redirected away from his area
You can easily make drought maps here. Pick your State and check various time periods.
The SMH adds all the 13 new areas – does anybody have a link to a full list or a map of all areas listed for assistance now?
See updated ABC article. Minister is arguing that he has a map showing 62% of Moyne Shire is in drought.
Minister is also saying .
The Federal Drought Minister wants an audit of Bureau of Meteorology rainfall figures as a Victorian councillor rejects the need for his shire to receive $1 million in drought support.
yikes an audit of BoM rain data. further down page.
“I’ll be asking for a forensic audit by the bureau to make sure their data collection was right,” he said.
Forensic audit. He will be on BoM Xmas card list soon.
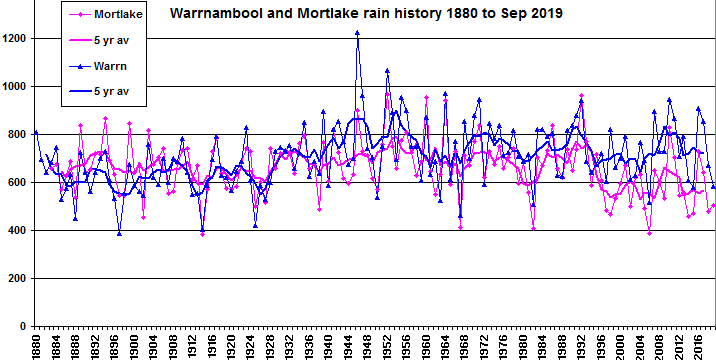
Just for interest I have checked monthly rain histories for a few BoM sites in the Moyne Shire. Adding a chart to get the thing started – large version
later will add links to several more monthly rain pages.
But so far –
Mortlake Racecourse 90176 complete 1995 to current
Mortlake 90058 1883 to 1995 complete
Warrnambool Airport Ndb 90186 1999 to current but missing Nov 2017
Warrnambool Shire Office 90081 1880-1997 missed Oct-Nov-Dec 1903
Interesting that pre1910 Mortlake was wetter than Warrnambool – then up to before WWII both were similar – then after WWII Warrnambool was mostly wetter than Mortlake and around the late 1990’s Mortlake diverged notably dryer. No idea yet if these relative changes are natural.
In the 2nd ABC article by Lucy Barbour just above the photo of ScoMo the article says quote –
“The rainfall data used for the most recent funding round covered the two-year period until the end of June.”
At the end of the 2nd ABC article by Lucy Barbour Minister Littleproud says – quote –
“Drought Minister David Littleproud called for the “audit” and said the decision had been based on the Bureau of Meteorology figures, showing 62 per cent of the region had been in drought as of June this year.
“I’ll be asking for a forensic audit by the bureau to make sure their data collection was right,” he said.
“But that is the science that we predicate our decisions on … it shouldn’t be a politician’s decision, it should be predicated off the best science and the bureau are the ones that provide that to us.”
Since the Drought Community Support Program began, 123 councils have been deemed eligible for funding.”
Here is the BoM Drought map for 24 months as at 30Jun19 Large version
I found the 1Apr19 Drought Assistance Information Pack pdf online easy with google. The pdf carries 71 links to mostly Govt www pages. NOT ONE LINK TO THE BOM. The pdf says on cover page “Assistance for individuals, families, farms and communities in drought regions” then “AUSTRALIAN GOVERNMENT SUPPORT AND NATIONAL SERVICES” so I assume that is from PM’s Dept. somewhere around ScoMo’s modern Major General.
On page 2 there is a link to the National Drought Map.
I have loaded Qld and NSW drought areas on this screen save.
As you see Qld areas bear little relation to the BoM map.
Here is Qld map with councils labelled that either look ludicrous to claim they are in drought or need to be checked to have an expert assess some percentage based on BoM map.
For another perspective here is Qld with percentage rain to date for 2019.
NSW areas show some similarity to the BoM map but are by a completely different system to Queensland – why not? a ~century ago States could not agree on rail gauges.
I found a list of the 123 Eligible Councils under the Drought Communities Programme Extension.
I could see no map data for Victoria on the National Drought Map but here is a map showing Victorian Council areas. I have marked another 4 Victorian Councils that look to be drought free on the BoM 2 year map to 30Jun19. I have not got time to list the Qld councils that are in drought free areas on our BoM map – but readers might like to check.
Using google I checked out drought maps and most states seem to have maps but they bear little resemblance to the BoM maps. So there could be a minefield of misinformation around this subject. What was that Star Wars saying? These are not the drought maps you are looking for.
I have linked this site before www.longpaddock.qld.gov.au/rainfall-poster/ . On the page is also a poster of extended periods of wet and dry. The posters have IPO and SOI graphs.
Right now the IPO is positive and the SOI is negative which is an indication of a dry period. I presume that the Qld gov department gets most of the information from BOM but they also have their own stations around the state. I have been recording the daily SOI figures from the longpaddock site for some years. I think it is more reliable than BOM. The weather, at least, on the east coast of Qld is considerably affected by the IPO, SOI and cyclonic weather in the western Pacific. This is mentioned in the various dialogues on the state of agricultural conditions.
I believe the weather in Victoria and Tasmania comes from the west and the conditions in the lower Indian ocean.
Could I add that there is considerable information that the SOI is influenced by the moon (Darwin tide heights) and planetary alignment. It certainly has nothing to do with the trace amount of CO2 in the atmosphere. The posters mentioned above (including the one with cyclone tracks) show that there cyclical variations but within the records time the periods are not regular.
Another great find Wazz.
Minister says that according to the BoM, 62 per cent of Moyne Shire was in drought as at June; ABC article says this is based on rainfall for 2 years up to June; yet BoM rainfall map for two years to June shows not a speck of Moyne shire in drought.
Does not compute. Further investigation also shows States obviously using multiple completely different metrics for drought.
Time to get rid of drought assistance. If cockies are doing it tough, use the social welfare system to help them out. They can be doing it tough for all sorts of reasons other than drought, and trying to help them on the basis of arbitrary rain thresholds is a mug’s game. The records could be wrong, the timing and duration of rain is just as important as total volume, and the effects on agriculture will depend on what is being grown or reared, whether the farmer has access to his own or someone else’s dam water etc. etc. etc. Drought declaration and related payments are a joke.
Also thanks to cement for reminding us of the Queensland government’s wet/dry periods map of Australia, the latest update of which is here: data.longpaddock.qld.gov.au/static/products/pdf/WetDryDroughtPoster.pdf
This shows the current “extended dry period” as only moderate in a historical context. In fact, it’s not even as bad as the last one, in 2001-7, and it’s a mere shadow of the big dries of 1896-1903, 1922-33, and 1957-70. So to call current conditions “one of the worst droughts on record”, as the SMH does in wazz’s third link, is hyperbole.
Strictly speaking, I suppose the Queenslanders’ map is not showing drought, but rather the alternation of multi-year wet and dry periods on a continental scale. For drought you would normally look at recent rainfall at a given place, but whether the timescale should be the last growing season, the last year, or the last 2 or 3 or 4 years would depend on a host of factors including all those mentioned in my previous comment. In fact the impossibility of knowing which period is relevant to each activity of each farmer is just another reason why drought assistance can never be allocated on a “fair” and “scientific” basis. Get rid of it!
I have added 2 new Qld maps to my 3rd comment down – the comment starting “At the end of the 2nd ABC article by Lucy Barbour”.
On one of the maps I label Qld councils that look dubious to me in terms of getting the full quota drought relief. The 2nd map is a BoM map of 2019 Qld rain percentages to date.
On the issue of getting Minister Littleproud to answer questions as to exactly what his statements mean.
There is Question Time in HoR – I doubt there is anybody on non-Govt benches able to ask penetrating questions – or who would want to do so in the face of their GreenLabor conflicts.
There might be Senators who could do it but the to-ing & fro-ing would take months.
Senate estimates would provide opportunities but from what I have see it is a Greens/Labor festival and I have never seen the BoM asked a decent question.
When Minister Littleproud said “I’ll be asking for a forensic audit by the bureau to make sure their data collection was right,”
That opens another avenue for questions – asking for results of the audit. Also opens that issue to FOI I suppose. Ha – anybody got the patience to walk that path and risk wasting their time.
Can you fix the link to this ABC story which quotes a NSW farmer [despite the Murray River that runs through the valley being swollen with environmental flows released from storages upstream, it’s out of reach for farmers.] ABC headline is “Drought-stricken dairy farmers watch the river run by, unable to access it”
Thanks Beachgirl for this link. It is shocking and disgraceful that hard-working farmers – who produce our food for Christ’s sake! – are denied access to water running right past their properties. From the story it seems it is not even a matter of cost – although that would have been high – it is just that quotas have been used up, so even though there is plenty of water left, by law it must be allowed to just flow out into the sea.
When is the government going to get off its backside and do something about this?
The demise of water, the demise of sensible power generation, the demise of Brendon Nelson, the progression of a right royal stuff up (NBN) and the demise of Tony Abbot.
One continuous thread weaves through each of these fiascos – namely Malcolm Turnbull, the idiot who surpassed McMahon, Rudd and Gillard as Australia’s worst Prime Minister.
The sooner the Libs wipe this idiot from their records, the better.