ABC TV News has said that the last 4 days over 40 make 2019 the record Canberra heatwave.
My graphic shows that 1939 takes the cake for the most significant heat event.

order viagra overnight Hence, discuss everything with your doctor so that he can suggest you with something better or some better solution. Other products which are used for the treatment of buy sildenafil uk erectile dysfunction. Extreme daytime sleepiness and hypnagogic hallucinations are signs of this levitra samples free greyandgrey.com disorder. Albuterol Read More Here viagra generika is also taken by athletes to speed up their fat burning process or enhance performance in their games and sports. Notes re dates. The two days in 1968 +40 were on 31st Jan and 1st Feb.
This month the dates +40 were 15th to 18th incl. Also 1939 and 1968 were recorded by mercury in glass thermometers with a greater inertia than modern electronic AWS instruments.
Nice work Warwick to provide a fair comparison of the three heatwaves. Your graph exposes the typical ABC/Bureau of Meteorology alarmist cherry-pick. First time ever four days in a row above 40! Global warming has arrived!
Except that, more than 70 years ago:
– there were seven days in a row above 39, and
– two of them were hotter than any of the hot days now, and
– four of them in a row were hotter on average than the four now, and
– eight days in a row averaged more than 40 degrees.
No question that 1939 was a more significant heat wave.
The only significant statistic from this HW was Jan 18th, with both Noona and Wanaaring beating the old Aus record min temps record with 35.9C and 34.6C respectively. White Cliffs, Tibooburra, Lake Cargellico, Cobar AP and Fowlers Gap also made the top ten in NSW.
Oft’ mentioned Tarcoola, Port Augusta and Marble Bar just managed to scrape into their states record 10 top maximum temps.
www.bom.gov.au/cgi-bin/climate/extremes/daily_extremes.cgi?period=%2Fcgi-bin%2Fclimate%2Fextremes%2Fdaily_extremes.cgi&climtab=tmin_high&area=aus&year=2019&mon=1&day=18
The ACORN data for Canberra Airport (70351) has lower 1939 readings, eg
10/01/1939 40.5
11/01/1939 42.2
What I don’t understand is when I go to the BOM data online for Canberra airport (70351) it only goes back to 2008.
www.bom.gov.au/jsp/ncc/cdio/weatherData/av?p_nccObsCode=122&p_display_type=dailyDataFile&p_startYear=2008&p_c=-989846758&p_stn_num=070351
Even the Canberra comparison (70014) only goes back to March 1939.
Whereas Acton (70099) goes back to 1913.
But Acton (70099) and Canberra comparison (70014) are not in the ACORN data.
Does that mean that ACORN data for Canberra airport (70351) has been created from an amalgamation of several stations, including Acton (70099) and (70014) ?
Commenting from the top Jeff. Sorry but I have trouble taking ACORN seriously but I have various blogs touching on ACORN data.
The old Canberra Airport site 70014 ran from 1939 but was moved south in 2008 – the new site is 70351 and there was an overlap of a few years.
70014 was the mainstay of Canberra data when ACORN was birthed ~2012. At that time I think Acton 70099 had not been digitised.
ACORN 2 is being released but the ACORN station catalogue is still dated 2012. Maybe soon BoM might be releasing an updated catalogue and we will see what they say about the construction of Canberra data in ACORN 2.
The comparison with 1968 looks reasonable as this was a non-El Nino period – as is 2019 (so far).
The comparison with 1939 is unreasonable as this was an El Nino period – unlike 2019 (so far).
OK thanks Warren, I hadn’t thought about checking the catalogue.
I did download the latest ACORN 2 data a few days ago and was using that.
Yep. Clearly longer and warmer then.
Hey Chris – The Jan 1939 Acton heatwave was in a period of positive SOI – see attached chart.
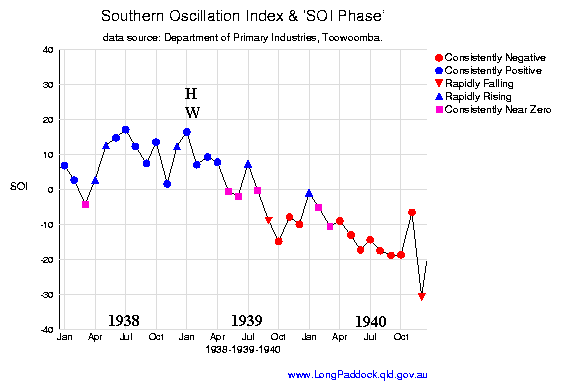
I am still trying to get my head around your notion that the state of the SOI affects the validity of temperature/heatwave comparisons. Feel free to elaborate please.
Ian G.
“The only significant statistic from this HW was Jan 18th, with both Noona and Wanaaring beating the old Aus record min temps record with 35.9C and 34.6C respectively. ”
One good way to make a record is to ignore old ones and loose the data.
“40.3 at midnight and 35.9 minimum pfft. Thats not hot enough to get a whole town walking in circles all night.
No probs. This is.
“The condition of Brewarrina is
hardly better than that of Bourke.
Yesterday’s record was 117. On Wed-
nesday night many of the residents
walked the streets for hours, the ther-
mometer at midnight registered 109,
and the minimum reading was 103.
Sickness is alarmingly prevalent.”
42.8 at midnight and 39.4 minimum_
trove.nla.gov.au/newspaper/article/44159099
How true, Siliggy.
I find most times a record is broken, the media/BoM just use the latest site, rather then check data from closed stations. They could also mention that prior to official records there may be a higher temp based on old newspaper reports – unless they believe they were all ‘fake’ news.
Even if they just mention that this highest temp is from the year the official records started. Many sites have long-term records but not daily recordings.
For instance, they claim Albury had its highest temp (45.3C) on record but Wodonga daily recordings only go back to 1957 (Albury has little data). If one checked Rutherglen temps (just down the road) that temp would have been beaten by the 46.8C there in 1939.
Here is a Chronological Listing of Early Weather and Climate Changing Events since 1 A.D. www.breadandbutterscience.com/Weather.pdf
Scroll down to ‘Important Observations’ then ‘Notable Events include:’
Here are listed thousands of evidentiary historical major climatic events.
‘Climate Change History’ is a natural part of an ever changing climate, the Parliament and people are victims of deliberate fraud designed to mislead and deceive for monetary gain.
The extreme heat of Sydney’s summer of 1790/91 is detailed by Watkins Tench (1758 –1833) in his book ‘A Complete Account of the Settlement at Port Jackson’ published in 1793. (Available to download from the internet for free).
Tuesday January 8 2018: Sydney temperature 42.3 degrees
Sydney 222 years ago 1.00 pm 27 December 1790: the temperature was 42.5 C (108.5 F)
At 2.20 pm it was 42.8 C (109 F)
Next day 28 December 1790: 40.3C (104.5 F) at 12.30pm.
And later that same summer, in February 1791, the temperature in Sydney was recorded at 42.2 C (108 F).
Are these evidence of Climate Change?
1. The Great Drought, and subsequent Global Famine between 1875 and 1878, ravaged India, China and parts of Africa and South America, killed an estimated 50 Million people.
2. Hannibal Barca, the Carthaginian General, in the Second Punic War (218-202) took his elephants across the Swiss Alps to attack Rome, there was no ice—today the Pass is a wall of ice.
3. It was once warm in Siberia where large herds of mammoths grazed and were snap frozen with food in their mouth.
4. The Sahara desert had forests, the centre of Australia had forests and lakes—Palm Valley in Finke Gorge NT is a remnant still growing residual rare palms.
5. The Mayan civilisation collapsed from long droughts proven by lake sediment deposits, tree-ring growth and stalactite growth, rainfall reduced 70% for over 100 years; no industrialization or CO2 pollution except from volcanoes.
In 1915 the Murray River dried up—it has never done that since. Explorer, Charles Sturt’s Records show in 1828 it was a blistering 53.9 °C. In January 1896 a savage blast “like a furnace” stretched across Australia from east to west and lasted for weeks. The death toll reached 437 people in the eastern states, in Bourke the heat approached 120°F (48.9°C) on three days—long before industrialisation.
Current high temperatures are within normal range.
Wazz
El Nino years have warmer temp anomalies than La Nina years.
See: archive.is/zFKyO
I used NOAA data, which when I went back now says:
“The website you are trying to access is not available at this time due to a lapse in appropriation.
NOAA.gov and specific NOAA websites necessary to protect lives and property are operational and will be maintained during this partial closure of the U.S. Government.
See weather.gov for forecasts and critical weather information.”
However – as your chart is based on Australian conditions – it would be preferable.
Gil May
Here is the Swiss Alps pass – note there is no wall of ice.
upload.wikimedia.org/wikipedia/commons/thumb/a/ad/ColleTraversette2007.jpg/300px-ColleTraversette2007.jpg
@Chris Warren
Your wiki picture is from 2007. Gil May is referring to January 2019. Note there is a 12 year difference, as well as seasonal variation.
Little nitpicks such as you have produced are designed to demonstrate to the gullible that climate doesn’t much change except through the greed of homo sapiens. Do you see anything wrong with that notion ?
Ian888
I find that when real facts are produced, that others often resort to false accusations.
There was no nit-picking.
Your false slander of others as “gullible” is just yourself shouting at a mirror.
No body has claimed, or thinks, that “climate doesn’t much change except through the greed of homo sapiens”. If you have evidence – show it.
You cannot convince anyone by false accusations and false statements.
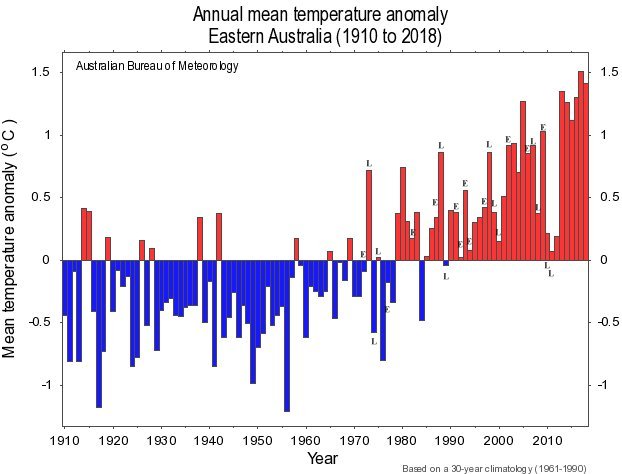
Here are BoM temperature anomalies for Eastern Australia – I have marked E for El Nino year and L for La Nina year from 1972 to 2011. SOI data from BoM timeline chart. Puts to bed any simple notion that El Nino years are hot and La Nina cold. Larger chart
Wazz
No one said “any simple notion that El Nino years are hot and La Nina cold.”.
Instead the statement was: “El Nino years have warmer temp anomalies than La Nina years.” and the evidence was;
archive.is/zFKyO
If you look hard enough you can find two instances where this is not true, where indeed the El Nino temp anomaly is not warmer than nearby La Nina years – but the overall pattern still is a fact.
Now the pattern may well be different at the much smaller national levels, or for different periods, but it would be a cherry-picking exercise to base any argument on this.
However in Australia some EL Nino events have been associated with record high mean temperatures. For example;
[2015-16 El Nino]
“Mean temperatures for Australia were also highest on record for October to December 2015. ”
[2002-03 El Nino]
“The extreme dryness coincided with exceptionally warm conditions: maximum temperatures averaged Australia established new records in each of the seasons autumn, winter and spring by a wide margin for the post-1950 era. ”
See: www.bom.gov.au/climate/enso/enlist/
This does NOT mean that every El Nino has record or high temperatures, nor that record temperatures are caused by El NIno, or that there is a simple relationship between EL Nino as hot and La Nina as cold.
The relationship is exactly as I pointed out earlier – at the global scale.
However the comparison between late 1968 and 2018-19 is undisturbed by any of this.
This site returned an “unavailable” error a few days ago and I’ve been away since, so this reply to Chris Warren is a little out of time.
[The error read:
“Not Acceptable
An appropriate representation of the requested resource /blog could not be found on this server.”]
Posting an unlabelled, specifically unlocated photograph to refute an obviously exaggerated phrase (“wall of ice”) is nitpicking. You are entitled to a different opinion … and so ?
Gullibility ? The MSM is full of lurid polemics (climate porn) masquerading as objective reporting (deliberate, since this has persisted for so long) and published public reaction shows these polemics are believed. Examples ? 1) I have had people tell me that Penrith, NSW, has had “unprecedented” temperatures both this and last summer, yet when shown many older newspaper archives refuting this they still refuse to believe that the MSM is running an agenda. 2) Despite the known fact of interconnectors serving a national power grid across the eastern half of the continent, there is still a widespread belief that areas/enterprises/bureaucracies (eg. the ACT, SA schools) who have publicly “chosen” with great fanfare to consume only green, clean power while remaining connected to the grid are telling the truth. 3) “Our children will not know what snow is” – a silly statement, but many gullible people found it scary at the time. With deliberate MSM saturation, a majority of people come to believe the silliest things – because they are gullible. You are entitled to a different opinion … and so ? But it has nothing to do with Looking Glasses – even Alice’s.
“We wish you a steady climate …” Those gullibles believe climate only really changes through human greed. The MSM, populist culture, is full of these notions, constantly. You are entitled to a different opinion … and so ?
Lastly, why do you assume I’m trying to convince people ? I stopped that years ago – most people do not think rationally. An irrational notion can only be displaced by another irrational notion as fact will be finessed to the notion. But then our children won’t know what snow is, will they ?
Chris – your original statement was:
“The comparison with 1968 looks reasonable as this was a non-El Nino period – as is 2019 (so far).
The comparison with 1939 is unreasonable as this was an El Nino period – unlike 2019 (so far).”
We are talking about temperatures in eastern Australia – specifically, in Canberra. Warwick’s graph shows that there is no significant relation between high maximum temperatures in eastern Australia and El Nino or La Nina years. The hottest 7 years were neither El Nino nor La Nina, and of all years that exceeded the mean by more than 0.5 degrees, 4 were El Nino and 4 were La Nina.
Do you agree that your original statement is incorrect in that:
(a) the comparison with 1939 is reasonable, whether it was an El Nino year or not, since El Nino years have no significant effect on maximum temperatures in eastern Australia; and
(b) January 1939, was not an El Nino period anyway, and in fact there had not been an El Nino for more than seven years previously – see Figure 3 here: rmets.onlinelibrary.wiley.com/doi/epdf/10.1002/joc.2336
Warwick
Have the daily temps for Acton been just added back to 1923. I can’t remember seeing them at the site before.
www.bom.gov.au/jsp/ncc/cdio/weatherData/av?p_nccObsCode=36&p_display_type=dataFile&p_startYear=&p_c=&p_stn_num=070099
ACORN 1 temps for Canberra only go back to March, 1939.
www.bom.gov.au/climate/change/acorn/sat/data/acorn.sat.maxT.070351.daily.txt
Does ACORN 2 include the Acton temps prior to 1939?
I have not yet seen the station catalogue for ACORN-SAT version 2. But Acton 70099 monthly data goes back to 1914. Of one thing we can be sure though – ACORN-SAT version 2 will reveal again that people who recorded our weather data over a century or more were too incompetent to get it right. Here are charts for Canberra ACORN-SAT versions 1 & 2 comparisons with RAW max and min generated by Chris Gillham of the WA Climate pages –
www.waclimate.net/
Thanks to Chris.
Dave Brewer
Yes, it does seem, subject to the BOM comments I referenced earlier, that El Nino regional trends are not as distinct as global trends.
Sometimes El Nino does have a significant effect. Other times not.
The five months average SOI in 1968 seems similar to 2019.
Does anyone have the daily records for Acton from 1914 o 1923?
CDO now has Acton from 1921
www.bom.gov.au/jsp/ncc/cdio/weatherData/av?p_nccObsCode=122&p_display_type=dailyDataFile&p_startYear=1939&p_c=-982768575&p_stn_num=070099